“Sound experimentation was profitable”

Last time I mentioned some papers on the historical role of statistics in medicine. Here they are, by Donald Mainland:

  • “Statistics in Clinical Research: Some General Principles” (1950) [journal, pdf]
  • “The Rise of Experimental Statistics and the Problems of a Medical Statistician” (1954) [journal, pdf]

I’ve just re-read them and they are excellent. What is the heart of statistical thinking? What are the most critical parts of (applied) statistical education? At just 8-9 pages each, they are valuable reading, especially as a gentle rejoinder in this age of shifting fashions around Data Science, concerns about the replicability crisis, and misplaced hopes that Big Data will fix everything painlessly.

Some of Mainland’s key points, with which I strongly agree:

  • The heart of statistical thinking concerns data design, even more so than data analysis. How should we design the study (sampling, randomization, power, etc.) in order to gather strong evidence and to avoid fooling ourselves?

    …the methods of investigating variation are statistical methods. Investigating variation means far more than applying statistical tests to data already obtained. … Statistical ideas, to be effective, must enter at the very beginning, i.e., in the planning of an investigation.

  • Whenever possible, a well-designed experiment is highly preferred over poorly-designed experimental or observational data. It’s stronger evidence… and, as industry has long recognized, it cuts costs.

    In all the applied sciences, inefficient or wrong methods of research or production cause loss of money. Therefore, sound experimentation was profitable; and so applied chemistry and physics adopted modern biological statistics while academic chemists, physicists, and even biologists were disregarding the revolution or resisting it, largely through ignorance.

  • Yes, of course you can apply statistical methods to “found” data. Sometimes you have no alternative (macroeconomics; data journalism); sometimes it’s just substantially cheaper (Big Data). But if you gather haphazard data and merely run statistical tests after the fact, you’re missing the point.

    These unplanned observations may be the only information available as a basis for action, and they may form a useful basis for planned experiments; but we should never forget their inferior status.

    …a significance test has no useful meaning unless an experiment has been properly designed.

  • Statistical education for non-statisticians spends too little time on good data design, and too much on a slew of cookbook formulas and tests.

    …the increase in the incidence of tests—statistical arithmetic—has continued, and so also, very commonly, has the disregard of the more important contribution of statistics, the principles and methods of sound, economical experimentation and valid inference… Another obvious cause is the common human tendency to use gadgets instead of thought. Here the gadgets are the arithmetical techniques, and the statistical “cookbooks” that have presented these techniques most lucidly, without primary emphasis on experimentation and logic, have undoubtedly done much harm.

  • Statistical education for actual applied statisticians also spends too little time on good data design, and too much on mathematics.

    The most important single element in the training (and continuous education) of any statistician is practical experience—experience of investigations for which he himself is responsible, with all their difficulties and disappointments.

    …even if a mathematician specializes in the statistical branch of mathematics, he is not thereby fitted to give guidance in the application of the methods.

  • As an investigator, you must understand statistical reasoning yourself. You can (and should!) hire an applied statistician to help with the details of study design and data analysis, but you must understand their viewpoint to benefit from their help.

    If, however, he is acquainted with the requirements for valid proof, he will often see that what looked like evidence is not evidence at all…

Of course study design is not all of statistics. But it’s a hugely important component that seems underappreciated in modern statistics curricula (at least in my experience). Even if it’s not the sexiest area of current research, I’m surprised my PhD program at CMU completely omits it from our education. (The BS and MS programs here do offer one course each. But I was offered much deeper courses in my MS at Portland State, covering design of experiments and also of survey samples.)

As a bonus, Mainland also offers advice on starting and running a statistical consulting unit. It’s aimed at medical scientists but useful more broadly.

I would quote more, but you should really just read the whole thing. Then comment to tell me why I’m wrong 🙂

After 6th semester of statistics PhD program

Posting far too late again, but here’s what I remember from last Spring…

This was my first semester with no teaching, TAing, or classes (besides one I audited for fun). As much as I enjoy these things, research has finally gone much faster and smoother with no other school obligations. The fact that our baby started daycare also helped, although it’s a bittersweet transition. At the end of the summer I passed my proposal presentation, which means I am now ABD!

Previous posts: the 1st, 2nd, 3rd, 4th, and 5th semesters of my Statistics PhD program.

Thesis research and proposal

During 2015, most of my research with my advisor, Jing Lei, was a slow churn through understanding and extending his sparse PCA work with Vince Vu. At the end of the year I hadn’t gotten far and we decided to switch to a new project… which eventually became my proposal, in a roundabout way.

We’d heard about the concept of submodularity, which seems better known in CS, and wondered where it could be useful in Statistics as well. Das & Kempe (2011) used submodularity to understand when greedy variable selection algorithms like Forward Selection (FS, aka Forward Stepwise regression) can’t do too much worse than Best Subsets regression. We thought this approach might give a new proof of model-selection consistency for FS. It turned out that submodularity didn’t give us a fruitful proof approach after all… but also that (high-dimensional) conditions for model-selection consistency of FS hadn’t been derived yet. Hence, this became our goal: Find sufficient conditions for FS to choose the “right” linear regression model (when such a thing exists), with probability going to 1 as the numbers of observations and variables go to infinity. Then, compare these conditions to those known for other methods, such as Orthogonal Matching Pursuit (OMP) or the Lasso. Finally, analyze data-driven stopping rules for FS—so far we have focused on variants of cross-validation (CV), which is surprisingly not as well-understood as I thought.

One thing I hadn’t realized before: when writing the actual proposal, the intent is to demonstrate your abilities and preparedness for research, not necessarily to plan out your next research questions. As it turns out, it’s more important to prove that you can ask interesting questions and follow through on them. Proposing concrete “future work” is less critical, since we all know it’ll likely change by the time you finish the current task. Also, the process of rewriting everything for the paper and talk was a helpful process itself in getting me to see the “big picture” ideas in my proofs.

Anyhow, it did feel pretty great to actually complete a proof or two for the proposal. Even if the core ideas really came from my advisor or other papers I’ve read, I did do real work to pull it all together and prepare the paper & talk.

Many thanks to everyone who attended my proposal talk. I appreciated the helpful questions and discussion; it didn’t feel like a grilling for its own sake (as every grad student fears). Now it’s time to follow through, complete the research, practice the paper-submission process, and write a thesis!

The research process

When we shifted gears to something my advisor does not already know much about, it helped me feel much more in charge and productive. Of course, he caught up and passed me quickly, but that’s only to be expected of someone who also just won a prestigious NSF CAREER award.

Other things that have helped: Getting the baby into day care. No TAing duties to divide my energy this semester. Writing up the week’s research notes for my advisor before each meeting, so that (1) the meetings are more focused & productive and (2) I build up a record of notes that we can copy-paste into papers later. Reading Cal Newport’s Deep Work book and following common-sense suggestions about keeping a better schedule and tracking better metrics. (I used to tally all my daily/weekly stats-related work hours; now I just tally thesis hours and try to hit a good target each week on those alone, undiluted by side stuff.)

I’m no smarter, but my work is much more productive, I feel much better, and I’m learning much more. Every month I look back and realize that, just a month ago, I’d have been unable to understand the work I’m doing today. So it is possible to learn and progress quite quickly, which makes me feel much better about this whole theory-research world. I just need to immerse myself, spend enough time, revisit it regularly enough, have a concrete research question that I’m asking—and then I’ll learn it and retain it far better than I did the HWs from classes I took.

Indeed, a friend asked what I’d do differently if I were starting the PhD again. I’d spend far less energy on classes, especially on homework. It feels good and productive to do HW, and being good at HW is how I got here… but it’s not really the same as making research progress. Besides, as interesting and valuable as the coursework has been, very little of it has been directly relevant to my thesis (and the few parts that were, I’ve had to relearn anyway). So I’d aim explicitly for “B equals PhD” and instead spend more time doing real research projects, wrapping them up into publications (at least conference papers). As it is, I have a pile of half-arsed never-finished class / side projects, which could instead be nice CV entries if I’d polished them instead of spending hours trying to get from a B to an A.

My advisor also pointed out that he didn’t pick up his immense store of knowledge in a class, but by reading many many papers and talking with senior colleagues. I’ve also noticed a pattern from reading a ton of papers on each of several specialized sub-topics. First new paper I encounter in an area: whoa, how’d they come up with this from scratch, what does it all mean? Next 2-3 papers: whoa, these all look so different, how will I ever follow the big ideas? Another 10-15 papers: aha, they’re actually rehashing similar ideas and reusing similar proof techniques with small variations, and I can do this too. Reassuring, but it does all take time to digest.

All that said, I still feel like a slowly-plodding turtle compared to the superstar researchers here at CMU. Sometimes it helps to follow Wondermark’s advice on how he avoided discouragement in webcomics: ignore the more-successful people already out there and make one thing at a time, for a long time, until you’ve made many things and some are even good.

(Two years in!) I had just learned the word “webcomics” from a panel at Comic-Con. I was just starting to meet other people who were doing what I was doing.

Let me repeat that: Two years and over a hundred strips in is when I learned there was a word for what I was doing.

I had a precious, lucky gift that I don’t know actually exists anymore: a lack of expectations for my own success. I didn’t know any (or very few) comic creators personally; I didn’t know their audience metrics or see how many Twitter followers they had or how much they made on Patreon. My comics weren’t being liked or retweeted (or not liked, or not retweeted) within minutes of being posted.

I had been able to just sit down and write a bunch of comics without anyone really paying attention, and I didn’t have much of a sense of impatience about it. That was a precious gift that allowed me to start finding my footing as a creator by the time anyone did notice me – when people did start to come to my site, there was already a lot of content there and some of it was pretty decent.

Such blissful ignorance is hard to achieve in a department full of high-achievers. I’ve found that stressing about the competition doesn’t help me work harder or faster. But when I cultivate patience, at least I’m able to continue (at my own pace) instead of stopping entirely.

[Update:] another take on this issue, from Jeff Leek:

Don’t compare myself to other scientists. It is very hard to get good evaluation in science and I’m extra bad at self-evaluation. Scientists are good in many different dimensions and so whenever I pick a one dimensional summary and compare myself to others there are always people who are “better” than me. I find I’m happier when I set internal, short term goals for myself and only compare myself to them.

Classes

I audited Christopher Phillips’ course Moneyball Nation. This was a gen-ed course in the best possible sense, getting students to think both like historians and like statisticians. We explored how statistical/quantitative thinking entered three broad fields: medicine, law, and sports.

Reading articles by doctors and clinical researchers, I got a context for how statistical evidence fits in with other kinds of evidence. Doctors (and patients!) find it much more satisfying to get a chemist’s explanation of how a drug “really works,” vs. a statistician’s indirect analysis showing that a drug outperforms placebo on average. Another paper confirmed for me that (traditional) Statistics’ biggest impact on science was better experimental design, not better data analysis. Most researchers don’t need to collaborate with a statistical theoretician to derive new estimators; they need an applied statistician who’ll ensure that their expensive experimental costs are well spent, avoiding confounding and low power and all the other issues.

[Update:] I’ve added a whole post on these medical articles.

In the law module, we saw how difficult it is to use statistical evidence appropriately in trials, and how lawyers don’t always find it to be useful. Of course we want our trial system to get the right answers as often as possible (free the innocent and catch the guilty), so from a purely stats view it’s a decision-theory question: what legal procedures will optimize your sensitivity and specificity? But the courts, especially trial by jury, also serve a distinct social purpose: ensuring that the legal decision reflects and represents community agreement, not just isolated experts who can’t be held accountable. When you admit complicated statistical arguments that juries cannot understand, the legal process becomes hard to distinguish from quack experts bamboozling the public, which undermines trust in the whole system. That is, you have the right to a fair trial by a jury of your peers; and you can’t trample on that right in order to “objectively” make fewer mistakes. (Of course, this is also an argument for better statistical education for the public, so that statistical evidence becomes less abstruse.)

[Update:] In a bit more detail, “juries should convict only when guilt is beyond reasonable doubt. …one function of the presumption of innocence is to encourage the community to treat a defendant’s acquittal as banishing all lingering suspicion that he might have been guilty.” So reasonable doubt is meant to be a fuzzy social construct that depends on your local community. If trials devolve into computing a fungible “probability of guilt,” you lose that specificity / dependence on local community, and no numerical threshold can truly serve this purpose of being “beyond a reasonable doubt.” For more details on this ritual/pageant view of jury trials, along with many other arguments against statistics in the courtroom, see (very long but worthwhile) Tribe (1971), “Trial by Mathematics: Precision and Ritual in the Legal Process” [journal, pdf].

[Note to self: link to some of the readings described above.]

Next time I teach I’ll also use Prof. Phillips’ trick for getting to know students: require everyone to sign up for a time slot to meet in his office, in small groups (2-4 people). This helps put names to faces and discover students’ interests.

Other projects

I almost had a Tweet cited in a paper 😛 Rob Kass sent along to the department an early draft of “Ten Simple Rules for Effective Statistical Practice” which cited one of my tweets. Alas, the tweet didn’t make it into the final version, but the paper is still worth a read.

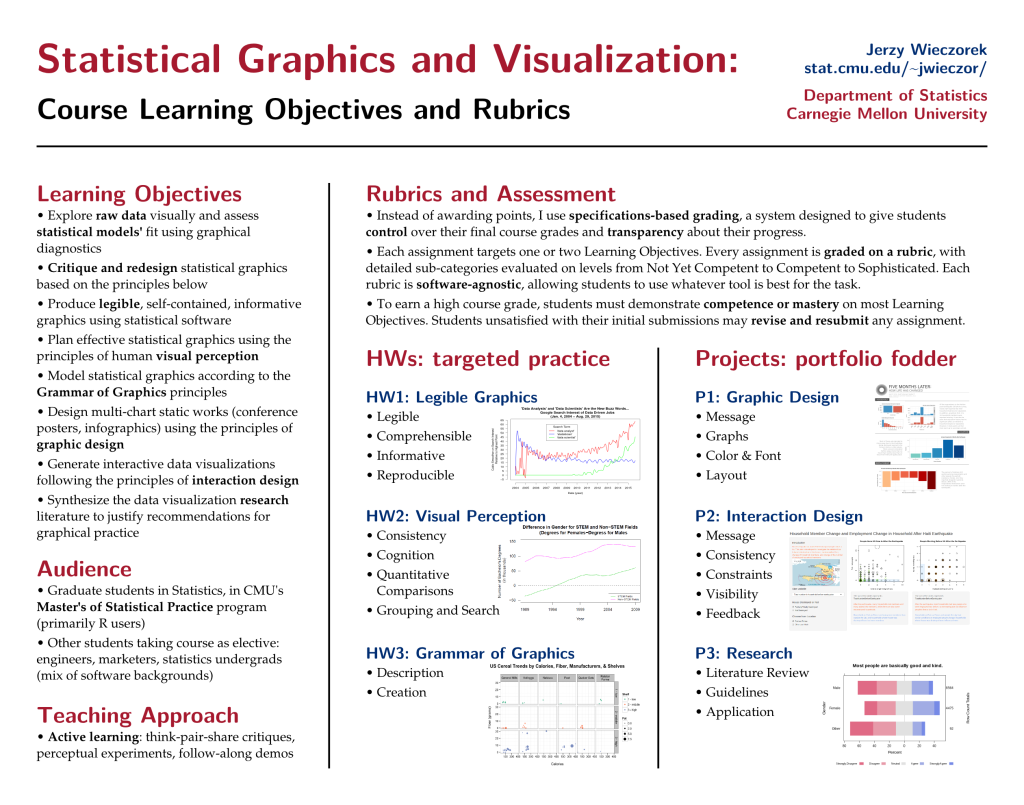
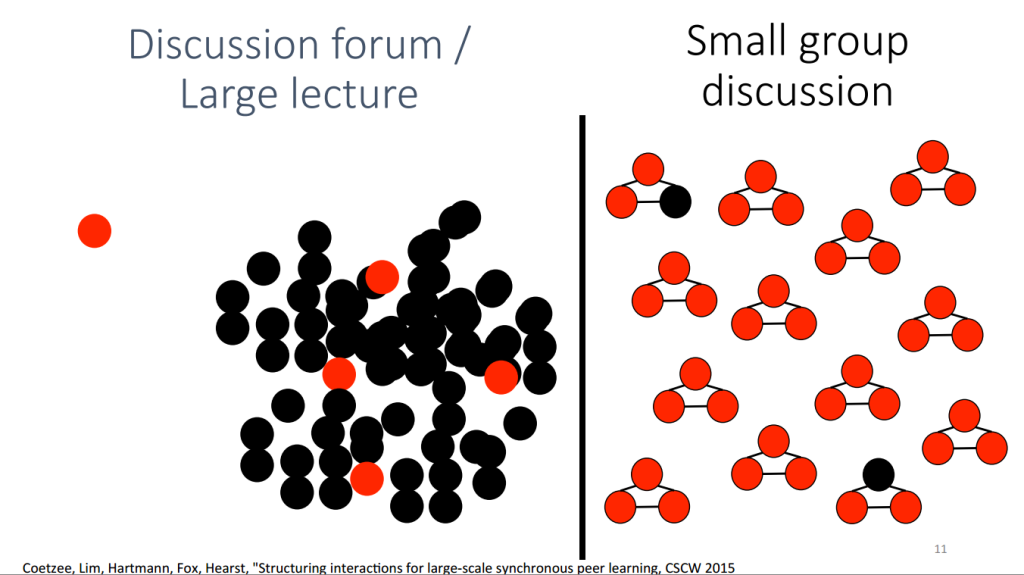
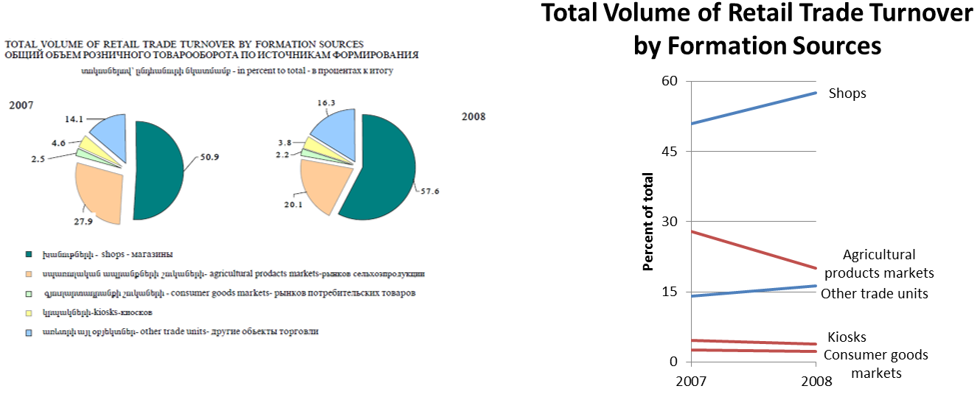
I also attended the Tapestry conference in Colorado, presenting course materials from the Fall 2015 dataviz class that I taught. See my conference notes here and here.

Even beyond that, it’s been a semester full of thought on statistical education, starting with a special issue in The American Statistician (plus supplementary material). I also attended a few faculty meetings in our college of humanities and social sciences, to which our statistics department belongs. They are considering future curricular revisions to the general-education requirements. What should it mean to have a well-rounded education, in general and specifically at this college? These chats also touch on the role of our introductory statistics course: where should statistical thinking and statistical evidence fit into the training of humanities students? This summer we started an Intro Stats working group for revising our department’s first course; I hope to have more to report there eventually.

Finally, I TA’ed for our department’s summer undergraduate research experience program. More on that in a separate post.

Life

My son is coordinated enough to play with a shape-sorter, which is funny to watch. He gets so frustrated that the square peg won’t go in the triangular hole, and so incredibly pleased when I gently nudge him to try a different hole and it works. (Then I go to meet my advisor and it feels like the same scene, with me in my son’s role…)

He’s had many firsts this spring: start of day care, first road trip, first time attending a wedding, first ER visit… Scary, joyful, bittersweet, all mixed up. It’s also becoming easier to communicate, as he can understand us and express himself better; but he also now has preferences and insists on them, which is a new challenge!

I’ve also joined some classmates in a new book club. A few picks have become new favorites; others really put me outside my comfort zone in reading things I’d never choose otherwise.

Next up

The 7th, 8th, 9th, and 10th semesters of my Statistics PhD program.

Seminar on Active Learning pedagogy

I’ve joined an Eberly Center seminar / reading group on the educational approach known as Active Learning (AL).

[Obviously our Statistics department should use Active Learning, the educational technique, to teach a course on Active Learning, the approach to experimental design. We can call it Active Active Learning Learning.]

The basic idea in AL is to replace traditional lectures and “passive” student behavior (listening quietly to an instructor speak, perhaps taking notes to transcribe the lecture) with almost anything more “active”: discussion with your neighbor or the whole class; short clicker quizzes; labs or larger projects; etc. The goal is to help your students stay attentive, motivated, and engaged, so they are constructing and synthesizing knowledge throughout class—instead of just being passive receptacles for the words you say.

I’ve tried variants of AL when teaching, and generally I liked the outcomes, but I hope the reading group will help me think through some challenges I had in implementation.

Notes-to-self below, posted in case any readers have thoughts or suggestions:
Continue reading “Seminar on Active Learning pedagogy”

After 5th semester of statistics PhD program

Better late than never—here are my hazy memories of last semester. It was one of the tougher ones: an intense teaching experience, attempts to ratchet up research, and parenting a baby that’s still too young to entertain itself but old enough to get into trouble.

Previous posts: the 1st, 2nd, 3rd, and 4th semesters of my Statistics PhD program.

Classes

I’m past all the required coursework, so I only audited Topics in High Dimensional Statistics, taught by Alessandro Rinaldo as a pair of half-semester courses (36-788 and 36-789). “High-dimensional” here loosely means problems where you have more variables (p) than observations (n). For instance, in genetic or neuroscience datasets, you might have thousands of measurements each from only tens of patients. The theory here is different than in traditional statistics because you usually assume that p grows with n, so that getting more observations won’t reduce the problem to a traditional one.

This course focused on some of the theoretical tools (like concentration inequalities) and results (like minimax bounds) that are especially useful for studying properties of high-dimensional methods. Ale did a great job covering useful techniques and connecting the material from lecture to lecture.

In the final part of the course, students presented recent minimax-theory papers. It was useful to see my fellow students work through how these techniques are used in practice, as well as to get practice giving “chalk talks” without projected slides. I gave a talk too, preparing jointly with my classmate Lingxue Zhu (who is very knowledgeable, sharp, and always great to work with!) Ale’s feedback on my talk was that it was “very linear”—I hope that was a good thing? Easy to follow?

Also, as in every other stats class I’ve had here, we brought up the curse of dimensionality—meaning that, in high-dimensional data, very few points are likely to be near the joint mean. I saw a great practical example of this in a story about the US Air Force’s troubles designing fighter planes for the “average” pilot.

Teaching

I taught a data visualization course! Check out my course materials here. There’ll be a separate post reflecting on the whole experience. But the summer before, it was fun (and helpful) to binge-read all those dataviz books I’ve always meant to read.

I’ve been able to repurpose my lecture materials for a few short talks too. I was invited to present a one-lecture intro to data viz for Seth Wiener‘s linguistics students here at CMU, as well as for a seminar on Data Dashboard Design run by Matthew Ritter at my alma mater (Olin College). I also gave an intro to the Grammar of Graphics (the broader concept behind ggplot2) for our Pittsburgh useR Group.

Research

I’m officially working with Jing Lei, still looking at sparse PCA but also some other possible thesis topics. Jing is a great instructor, researcher, and collaborator working on many fascinating problems. (I also appreciate that he, too, has a young child and is understanding about the challenges of parenting.)

But I’m afraid I made very slow research progress this fall. A lot of my time went towards teaching the dataviz course, and plenty went to parenthood (see below), both of which will be reduced in the spring semester. I also wish I had some grad-student collaborators. I’m not part of a larger research group right now, so meetings are just between my advisor and me. Meetings with Jing are very productive, but in between it’d also be nice to hash out tough ideas together with a fellow student, without taking up an advisor’s time or stumbling around on my own.

Though it’s not quite the same, I started attending the Statistical Machine Learning Reading Group regularly. Following these talks is another good way to stretch my math muscles and keep up with recent literature.

Life

As a nice break from statistics, we got to see our friends Bryan Wright and Yuko Eguchi both defend their PhD dissertations in musicology. A defense in the humanities seems to be much more of a conversation involving the whole committee, vs. the lecture given by Statistics folks defending PhDs.

Besides home and school, I’ve been a well-intentioned but ineffective volunteer, trying to manage a few pro bono statistical projects. It turns out that virtual collaboration, managing a far-flung team of people who’ve never met face-to-face, is a serious challenge. I’ve tried reading up on advice but haven’t found any great tips—so please leave a comment if you know any good resources.

So far, I’ve learned that choosing the right volunteer team is important. Apparent enthusiasm (I’m eager to have a new project! or even eager for this particular project!) doesn’t seem to predict commitment or followup as well as apparent professionalism (whether or not I’m eager, I will stay organized and get s**t done).

Meanwhile, the baby is no longer in the “potted-plant stage” (when you can put him down and expect he’ll still be there a second later), but not yet in day care, while my wife is returning to part-time work. After this semester, we finally got off the wait-lists and into day care, but meanwhile it was much harder to juggle home and school commitments this semester.

However, he’s an amazing little guy, and it’s fun finally taking him to outings and playdates at the park and zoo and museums (where he stares at the floor instead of exhibits… except for the model railroad, which he really loved!) We also finally made it out to Kennywood, a gorgeous local amusement park, for their holiday light show.

Here’s to more exploration of Pittsburgh as the little guy keeps growing!

Next up

The 6th, 7th, 8th, 9th, and 10th semesters of my Statistics PhD program.

Lunch with ASA president Jessica Utts

The president of the American Statistical Association, Jessica Utts, is speaking tonight at the Pittsburgh ASA Chapter meeting. She stopped by CMU first and had lunch with us grad students here.

LOGO FINALBRAND_Tagline under

First of all, I recommend reading Utts’ Comment on statistical computing, published 30 years ago. She mentioned a science-fiction story idea about a distant future (3 decades later, i.e. today!) in which statisticians are forgotten because everyone blindly trusts the black-box algorithm into which we feed our data. Of course, at some point in the story, it fails dramatically and a retired statistician has to save the day.
Utts gave good advice on avoiding that dystopian future, although some folks are having fun trying to implement it today—see for example The Automatic Statistician.
In some ways, I think that this worry (of being replaced by a computer) should be bigger in Machine Learning than in Statistics. Or, perhaps, ML has turned this threat into a goal. ML has a bigger culture of Kaggle-like contests: someone else provides data, splits it into training & test sets, asks a specific question (prediction or classification), and chooses a specific evaluation metric (percent correctly classified, MSE, etc.) David Donoho’s “50 years of Data Science” paper calls this the Common Task Framework (CTF). Optimizing predictions within this framework is exactly the thing that an Automatic Statistician could, indeed, automate. But the most interesting parts are the setup and interpretation of a CTF—understanding context, refining questions, designing data-collection processes, selecting evaluation metrics, interpreting results… All those fall outside the narrow task that Kaggle/CTF contestants are given. To me, such setup and interpretation are closer to the real heart of statistics and of using data to learn about the world. It’s usually nonsensical to even imagine automating them.

Besides statistical computing, Utts has worked on revamping statistics education more broadly. You should read her rejoinder to George Cobb’s article on rethinking the undergrad stats curriculum.

Utts is also the Chief Reader for grading the AP Statistics exams. AP Stats may need to change too, just as the undergraduate stats curriculum is changing… but it’s a much slower process, partly because high school AP Stats teachers aren’t actually trained in statistics the way that college and university professors are. There are also issues with computer access: even as colleges keep moving towards computer-intensive methods, in practice it remains difficult for AP Stats to assess fairly anything that can’t be done on a calculator.

Next, Utts told us that the recent ASA statement on p-values was inspired as a response to the psychology journal, BASP, that banned them. I think it’s interesting that the statement is only on p-values, even though BASP actually banned all statistical inference. Apparently it was difficult enough to get consensus on what to say about p-values alone, without agreeing on what to say about alternatives (e.g. publishing intervals, Bayesian inference, etc.) and other related statistical concepts (especially power).

Finally, we had a nice discussion about the benefits of joining the ASA: networking, organizational involvement (it’s good professional experience and looks good on your CV), attending conferences, joining chapters and sections, getting the journals… I learned that the ASA website also has lesson plans and teaching ideas, which seems quite useful. National membership is only $18 a year for students, and most local chapters or subject-matter sections are cheap or free.

The ASA has also started a website Stats.org for helping journalists understand, interpret, and report on statistical issues or analyses. If you know a journalist, tell them about this resource. If you’re a statistician willing to write some materials for the site, or to chat with journalists who have questions, go sign up.

Tapestry 2016 materials: LOs and Rubrics for teaching Statistical Graphics and Visualization

Here are the poster and handout I’ll be presenting tomorrow at the 2016 Tapestry Conference.

Poster "Statistical Graphics and Visualization: Course Learning Objectives and Rubrics"

My poster covers the Learning Objectives that I used to design my dataviz course last fall, along with the grading approach and rubric categories that I used for assessment. The Learning Objectives were a bit unusual for a Statistics department course, emphasizing some topics we teach too rarely (like graphic design). The “specs grading” approach1 seemed to be a success, both for student motivation and for the quality of their final projects.

The handout is a two-sided single page summary of my detailed rubrics for each assignment. By keeping the rubrics broad (and software-agnostic), it should be straightforward to (1) reuse the same basic assignments in future years with different prompts and (2) port these rubrics to dataviz courses in other departments.

I had no luck finding rubrics for these learning objectives when I was designing the course, so I had to write them myself.2 I’m sharing them here in the hopes that other instructors will be able to reuse them—and improve on them!

Any feedback is highly appreciated.


Footnotes:

PolicyViz episode on teaching data visualization

When I was still in DC, I knew Jon Schwabish’s work designing information and data graphics for the Congressional Budget Office. Now I’ve run across his podcast and blog, PolicyViz. There’s a lot of good material there.

I particularly liked a recent podcast episode that was a panel discussion about teaching dataviz. Schwabish and four other experienced instructors talked about course design, assignments and assessment, how to teach implementation tools, etc.

I recommend listening to the whole thing. Below are just notes-to-self on the episode, for my own future reference.

Continue reading “PolicyViz episode on teaching data visualization”

Participant observation in statistics classes (Steve Fienberg interview)

CMU professor Steve Fienberg has a nice recent interview at Statistics Views.

He brings up great nuggets of stats history, including insights into the history and challenges of Big Data. I also want to read his recommended books, especially Fisher’s Design of Experiments and Raiffa & Schlaifer’sApplied Statistical Decision Theory. But my favorite part was about involving intro stats students in data collection:

One of the things I’ve been able to do is teach a freshman seminar every once in a while. In 1990, I did it as a class in a very ad hoc way and then again in 2000, and again in 2010, I taught small freshman seminars on the census. Those were the census years, so I would bring real data into the classroom which we would discuss. One of the nice things about working on those seminars is that, because I personally knew many of the Census Directors, I was able to bring many of them to class as my guests. It was great fun and it really changes how students think about what they do. In 1990, we signed all students up as census enumerators and they did a shelter and homeless night and had to come back and describe their experiences and share them. That doesn’t sound like it should belong in a stat class but I can take you around here at JSM and introduce you to people who were in those classes and they’ve become statisticians!

What a great teaching idea 🙂 It reminds me of discussions in an anthropology class I took, where we learned about participant observation and communities of practice. Instead of just standing in a lecture hall talking about statistics, we’d do well to expose students to real-life statistical work “in the field”—not just analysis, but data collection too. I still feel strongly that data collection/generation is the heart of statistics (while data analysis is just icing on the cake), and Steve’s seminar is a great way to hammer that home.

Teaching data visualization: approaches and syllabi

While I’m still working on my reflection of the dataviz course I just taught, there were some useful dataviz-teaching talks at the recent IEEE VIS conference.

Jen Christiansen and Robert Kosara have great summaries of the panel on “Vis, The Next Generation: Teaching Across the Researcher-Practitioner Gap.”

Even better, slides are available for some of the talks: Marti Hearst, Tamara Munzner, and Eytan Adar. Lots of inspiration for the next time I teach.

Hearst_ClassDiscussions

Finally, here are links to the syllabi or websites of various past dataviz courses. Browsing these helps me think about what to cover and how to teach it.

Update: More syllabi shared through the Isostat mailing list:

Not quite data visualization, but related:

Comment below or tweet @civilstat with any others I’ve missed, and I’ll add them to the list.
(Update: Thanks to John Stasko for links to many I missed, including his own excellent course site & resource page.)

Statistical Graphics and Visualization course materials

I’ve just finished teaching the Fall 2015 session of 36-721, Statistical Graphics and Visualization. Again, it is a half-semester course designed primarily for students in the MSP program (Masters of Statistical Practice) in the CMU statistics department. I’m pleased that we also had a large number of students from other departments taking this as an elective.

For software we used mostly R (base graphics, ggplot2, and Shiny). But we also spent some time on Tableau, Inkscape, D3, and GGobi.

We covered a LOT of ground. At each point I tried to hammer home the importance of legible, comprehensible graphics that respect human visual perception.

Pie chart with remake
Remaking pie charts is a rite of passage for statistical graphics students

My course materials are below. Not all the slides are designed to stand alone, but I have no time to remake them right now. I’ll post some reflections separately.

Download all materials as a ZIP file (38 MB), or browse individual files:
Continue reading “Statistical Graphics and Visualization course materials”