Pithy and pragmatic textbooks

I enjoy the rare statistics textbook that can take its subject with a grain of salt:

The practitioner has heard that the [random field] should be ergodic, since “this is what makes statistical inference possible,” but is not sure how to check this fact and proceeds anyway, feeling vaguely guilty of having perhaps overlooked something very important.
Geostatistics: Modeling Spatial Uncertainty, by Chilès and Delfiner.

It’s a familiar feeling!
As Chilès and Delfiner wryly suggest, we statisticians could often do a better job of writing for beginners or practitioners. We should not just state the assumptions needed by our tools, but also explain how sensitive results are to the assumptions, how to check these assumptions in practice, and what else to try if they’re not met.

Pun for the money

Today’s post is brought to you by my language nerd side.

First of all, this weekend brings the O’Henry Pun-Off World Championships in Austin, Texas. Read more about the Pun-Off in an excerpt from John Pollack’s book, The Pun Also Rises, which is also the prize of an online pun contest run by the online store Marbles.
(My submission: “Hey baby, you must be a Latin noun, because I could never decline you.”)
More good (bad?) puns from Chemistry Cat and Condescending Literature Pun Dog.

For DC-area residents, today is also the first day to register for summer language classes with the Global Language Network. Whether you want to hone your Spanish, start on Mandarin, or get exposed to something more uncommon (Azerbaijani, Georgian, Yoruba?), I highly recommend the GLN. It’s potentially free — your $150 deposit is returned to you unless you miss more than a quarter of the classes. (Even paying the full price, it’s still a great deal.) I’ve taken a couple of Turkish classes there, then taught Polish for the past year, and it’s been a great experience both as student and teacher.

DC word nerds may also enjoy the Spelling Buzz, held most Fridays at 8pm at Rock & Roll Hotel on H St NE. It’s a spelling bee with drinking: contestants must have a drink in hand at all times, and the MC can make you drink at any point. Pro tip: he usually uses the Sharon Herald spelling bee word lists, so if you study ahead of time you might do reasonably well. At the very least, be sure you’re solid on “diphtheria” and “ophthalmology” before you go.

Finally: If pun contests, language classes, and spelling bees are still not nerdy enough for you, then have you heard of linguistics olympiads? They’re like math olympiads but with these language puzzles that I find amazingly addictive. For example, given a few words in a language you’ve never learned, can you find translations (or pronunciations) of new phrases? Or can you figure out the patterns behind an alternative to Braille?
I wish I’d had the opportunity to do a linguistics olympiad in high school. But luckily there are some excellent problem sets online thanks to the folks behind the International Linguistics Olympiad, North American Computational Linguistics Olympiad, and Princeton and University of Oregon. If you like cryptic crosswords, these might be up your alley too.

JSM: accessible for first-year grad students?

A friend of mine has just finished his first year of a biostatistics program. I’m encouraging him to attend the Joint Statistical Meetings (JSM) conference in San Diego this July/August. He asked:

Some of the talks look really interesting, though as a someone who’s only been through the first year of a master’s program, I wonder if I’d be able to understand much.  When you went as a student, did you find the presentations to be accessible?

I admit a lot of the talks went over my head the first year — and many still do. Some talks are too specialized even for an experienced statistician who just has a different focus… But there are always plenty of accessible talks as well:

  • Talks on teaching statistical literacy or Stats 101 might be useful if you’re ever a TA or consultant
  • Talks on data visualization may focus on communicating results rather than on technical details
  • Overview lectures can introduce you to a new field
  • Some folks are known for generally being accessible speakers (a few off the top of my head: Hadley Wickham, Persi Diaconis, Andrew Gelman, Don Rubin, Dick DeVeaux, David Cox, Hal Varian… and plenty of others)

And it’s worthwhile for a grad student to start getting to know other statisticians and becoming immersed in your field.

  • There’s a nice opening night event for first-time attendees, and the Stat Bowl contest for grad students; in both of those, I made some friends I keep seeing again at later JSMs
  • Even when the talk is too advanced, it’s still fun to see a lecture by the authors of your textbooks, meet the folks who invented a famous estimator, etc.
  • You can get involved in longer-term projects: after attending the Statistics Without Borders sessions, I’ve become co-chair of the SWB website and co-authored a paper that’s now under review
  • It’s fun to browse the books in the general exhibit hall, get free swag, and see if any exhibitors are hiring; there is also a career placement center although I haven’t used it myself

Even if you’re a grad student or young statistician just learning the ropes, I definitely think it’s worth the trip!

API, and online mapping platforms

The Census Bureau is beta-testing a new API for developers. As I understand it, within hours of the API going live, Jan Vink incorporated it into an updated version of the interactive maps I’ve discussed before.

I think the placement of the legend on the side makes it easier to read than the previous version, where it was below. It’s a great development for the map — and a good showcase for the Census Bureau’s API, which I hope will become ready for public use in the near future.

I’d love to see this and related approaches become available in several environments or frameworks for online/interactive mapping tools. One possibility is to make widgets for the ArcGIS Viewer for Flex platform, which works with ESRI’s ArcGIS products.

Another great environment I’m just learning about is Weave. This week the Census Bureau is hosting Dr. Georges Grinstein, of the University of Massachusetts at Lowell, who is building a powerful open-source platform for integrating and visualizing data. This is being developed alongside a consortium of local governments and nonprofits who are using Weave for information dashboards, data dissemination, etc.
It seems to be a mix of Actionscript, Javascript, and C++, so extending Weave’s core functionality sounds a bit daunting, but I was very glad to see that advanced users can call R scripts inside of a visualization. This will let you analyze and plot data in ways that the Weave team did not explicitly foresee.

In short, there’s plenty of exciting work being done in this arena!

In defense of the American Community Survey

Disclaimer: All opinions expressed on this blog are my own and are not intended to represent those of the U.S. Census Bureau.
Edit: Please also read the May 11th official statement responding to the proposed cuts, by Census Bureau Director Robert Groves.
(Again, although of course my opinions are informed by my work with the Bureau, my post below is strictly as a private citizen. I have neither the authority nor the intent to be an official spokesperson for the Census Bureau.)

Yesterday the U.S. House of Representatives voted to eliminate the American Community Survey (ACS). The Senate has not passed such a measure yet. I do not want to get political, but in light of these events it seems appropriate to highlight some of the massive benefits that the ACS provides.

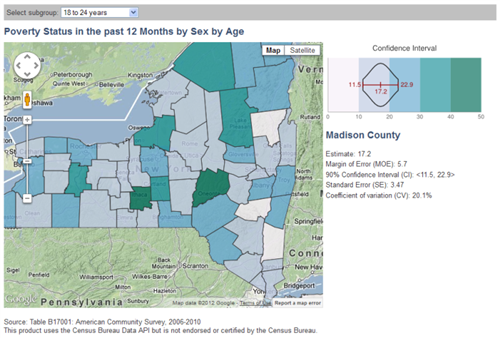
For many variables and indicators, the ACS is the only source of nationally-comparable local data. That is, if you want a detailed look at trends and changes over time, across space, or by demographic group, the ACS is your best dataset for many topics. Take a look at the list of data topics on the right-hand side of the ACS homepage: aging, disability, commuting to work, employment, language, poverty…

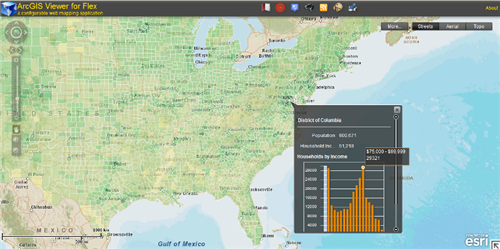
Businesses use the ACS to analyze markets: Can people afford our product here?  Should we add support for speakers of other languages? Does the aging population here need the same services as the younger population there? Similarly, public health officials use ACS information about population density when deciding where to place a new hospital. Dropping the ACS would increase risks with no corresponding direct benefits to businesses or local governments.

Local authorities can and do commission their own local studies of education levels or commute times; but separate surveys by each area might use incompatible questions. Only the ACS lets them compare such data to their neighbors, to similar localities around the country, and to their own past.

The Census Bureau works long and hard to ensure that each survey is well-designed to collect only the most important data with minimal intrusion. For example, even the flush toilet question (cited deprecatingly by the recent measure’s author) is useful data about infrastructure and sanitation. From the ACS page on “Questions on the form and why we ask”:

Complete plumbing facilities are defined as hot and cold running water, a flush toilet, and a bathtub or shower. These data are essential components used by the U.S. Department of Housing and Urban Development in the development of Fair Market Rents for all areas of the country. Federal agencies use this item to identify areas eligible for public assistance programs and rehabilitation loans. Public health officials use this item to locate areas in danger of ground water contamination and waterborne diseases.

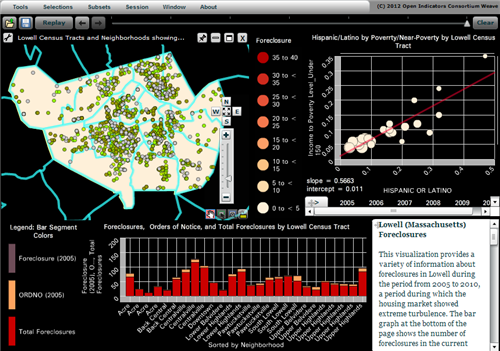
Besides the direct estimates from the ACS itself, the Census Bureau uses ACS data as the backbone of several other programs. For example, the Small Area Income and Poverty Estimates program provides annual data to the Department of Education for use in allocating funds to school districts, based on local counts and rates of children in poverty. Without the ACS we would be limited to using smaller surveys (and thus less accurate information about poverty in each school district) or older data (which can become outdated within a few years, such as during the recent recession). Either way, it would hurt our ability to allocate resources fairly to schoolchildren nationwide.

Similarly, the Census Bureau uses the ACS to produce other timely small-area estimates required by Congressional legislation or requested by other agencies: the number of people with health insurance, people with disabilities, minority language speakers, etc. The legislation requires a data source like the ACS not only so that it can be carried out well, but also so its progress can be monitored.

Whatever our representatives may think about the costs of this survey, I hope they reflect seriously on all its benefits before deciding whether to eliminate the ACS.