useR 2012: main conference braindump

I knew R was versatile, but DANG, people do a lot with it:

> > … I don’t think anyone actually believes that R is designed to make *everyone* happy. For me, R does about 99% of the things I need to do, but sadly, when I need to order a pizza, I still have to pick up the telephone. —Roger Peng

> There are several chains of pizzerias in the U.S. that provide for Internet-based ordering (e.g. www.papajohnsonline.com) so, with the Internet modules in R, it’s only a matter of time before you will have a pizza-ordering function available. —Doug Bates

Indeed, the GraphApp toolkit … provides one (for use in Sydney, Australia, we presume as that is where the GraphApp author hails from). —Brian Ripley

So, heads up: the following post is super long, given how much R was covered at the conference. Much of this is a “notes-to-self” braindump of topics I’d like to follow up with further. I’m writing up the invited talks, the presentation and poster sessions, and a few other notes. The conference program has links to all the abstracts, and the main website should collect most of the slides eventually.

Continue reading “useR 2012: main conference braindump”

Maps of changes in area boundaries, with R

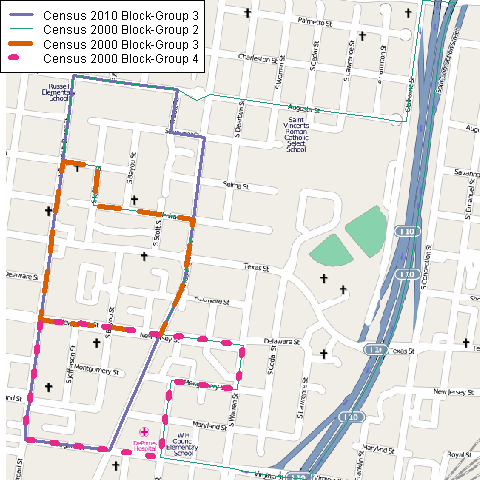
Today a coworker needed some maps showing boundary changes. I used what I learned last week in the useR 2012 geospatial data course to make a few simple maps in R, overlaid on OpenStreetMap tiles. I’m posting my maps and my R code in case others find them useful.

A change in Census block-groups from 2000 to 2010, in Mobile, AL

Continue reading “Maps of changes in area boundaries, with R”

useR 2012: impressions, tutorials

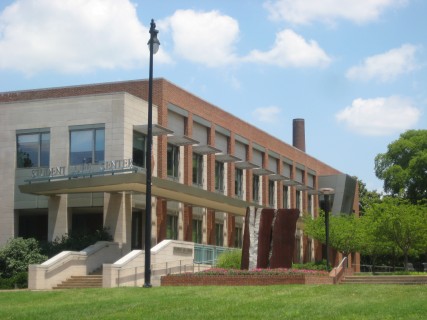
First of all, useR 2012 (the 8th International R User Conference) was, hands down, the best-organized conference I’ve had the luck to attend. The session chairs kept everything moving on time, tactfully but sternly; the catering was delicious and varied; and Vanderbilt University’s leafy green campus and comfortable facilities were an excellent setting. Many thanks to Frank Harrell and the rest of Vanderbilt’s biostatistics department for hosting!

Plus there's a giant statue of bacon. What's not to love?

Continue reading “useR 2012: impressions, tutorials”