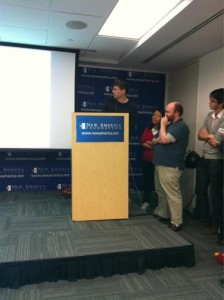
This weekend I had an absolute blast taking part in the DC Datadive hosted by the NYC-based Data Without Borders (DWB). It was somewhat like a hackathon, but rather than competing to develop an app with commercial potential, we were tasked with exploring data to produce insights for social good. (Perhaps it’s more like the appropriate-technology flash conferences for engineers that my classmates organized back at Olin.) In any case, we mingled on Friday night, chose one of three projects to focus on for Saturday (10am to 5am, in our case!), and presented Sunday morning.

There were three organizations acting as project sponsors (presentations here):
- The National Environmental Education Foundation wondered how to evaluate their own efforts to increase environmental literacy among the US public. Their volunteers came up with great advice and even found some data NEEF didn’t realize they already had.
- GuideStar, a major database of financial information on nonprofit organizations, wanted early-warning prediction of nonprofits that are at risk of failing, as well as ways to highlight high-performing organizations that are currently under the radar. This group of datadivers essentially ran their own Netflix prize contest, assembling an amazing range of machine learning approaches that each gave a new insight into the data.
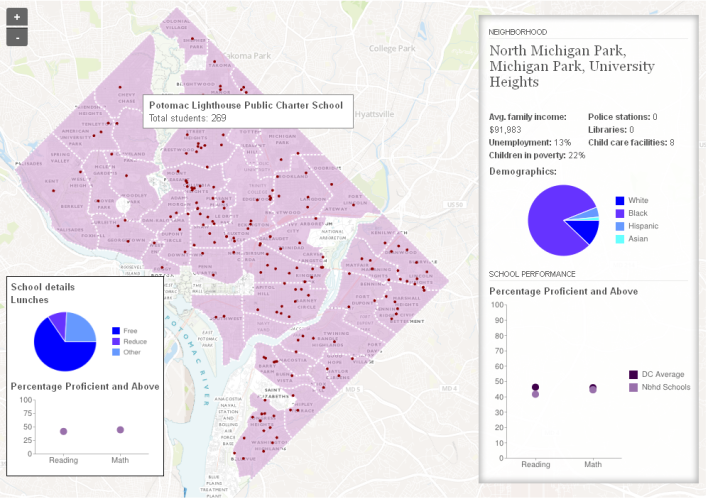
- DC Action for Children tasked us with creating a visualization to clearly express how children’s well-being, health, school performance, etc. are related to the neighborhood where they live. I chose to work on this project and am really pleased with the map we produced: screenshot and details below.
Click above and try it out. Mousing over each area gives its neighborhood-level information; hovering over a school gives school details.
In short, our map situates school performance (percent of children with Proficient or Advanced scores on reading and math tests) in the context of their DC neighborhood. Forgive me if I’m leaving out important nuances, but as I understood it the idea was to change the conversation from “The schools on this list are failing so they must have poor adminstration, bad teachers, etc.” towards “The children attending the schools in this neighborhood have it rough: socioeconomic conditions, few resources like libraries and swimming pools, no dentists or grocery stores, etc. Maybe there are other factors that public policy should address before putting full responsibility on the school.” I think our map is a good start on conveying this more effectively than a bunch of separated tables.
It was so exciting to have a tangible “product” to show off. There may be a few minor technical glitches, and we did not have time to show all of the data that the other subteams collected, but it’s a good first draft.
Planning and coordinating our giant group was a bit tough at first but our DWB coordinator, Zac, gamely kept us moving and communicating across the several sub-teams that we formed. The data sub-team found, organized, and cleaned a bunch more variables than we could put in, so that whoever continues this work will have lots of great data to use. And the GIS sub-team aggregated it all to several levels (Census tract, neighborhood, and ward); again we only had time to implement one level on map, but all is ready to add the other levels when time allows.
As for myself, I worked mostly with the visualization sub-team: Nick who set up the core map in TileMill; Jason who kept pushing it forward until 5am; Sisi who styled it and cobbled together the info boxes out of HTML and the Google Charts API and who knows what else; and a ton of other fantastic people whose handles I can’t place at the moment. I learned A TON from everybody and was just happy that my R skills let me contribute to this great effort.
[Edit: It was amiss not to mention Nick’s coworkers Troy and Andy who provided massive help with the GIS prep and the TileMill hosting. Andy has a great writeup of the tools, which they also use for their maps of the week.]
I absolutely loved the collaborative spirit: people brought so many different skills and backgrounds to the team, and we made new connections that I hope will continue with future work on this or similar projects. Perhaps some more of us will join the Data Science DC Meetup group, for example.
I do wish I had spent more time talking to people on the other projects — I was so engrossed in my own team’s work that I didn’t get to see what other groups were doing until the Sunday presentations. Thank goodness for catching up later via Twitter and #dcdatadive.
A huge thanks to New America Foundation for hosting us (physically as well as with a temporary TileMill account), to the Independent Sector NGEN Fellows for facilitating, to whoever brought all the delicious food, and of course to DWB for putting it all together. I hope this is just the start of much more such awesomeness!
PS — my one and only concern: The wifi clogged up early on Saturday, when everyone was trying to get data from the shared Dropboxes at once. If you plan to attend a future datadive, I’d suggest bringing a USB stick to ease sharing of big files if the wifi collapses.
[Edit: I also recommend DC Action for Children’s blog posts on their hopes before the datadive and their reactions afterwards. They have also shared a good article with more open questions about how kids are impacted by inequality in and among DC neighborhoods.]


Great map! This is the best kind of collaborative effort – stats and GIS in one room!
Nice work… if only someone would “listen” to the data.