Updated d3 idiopleth

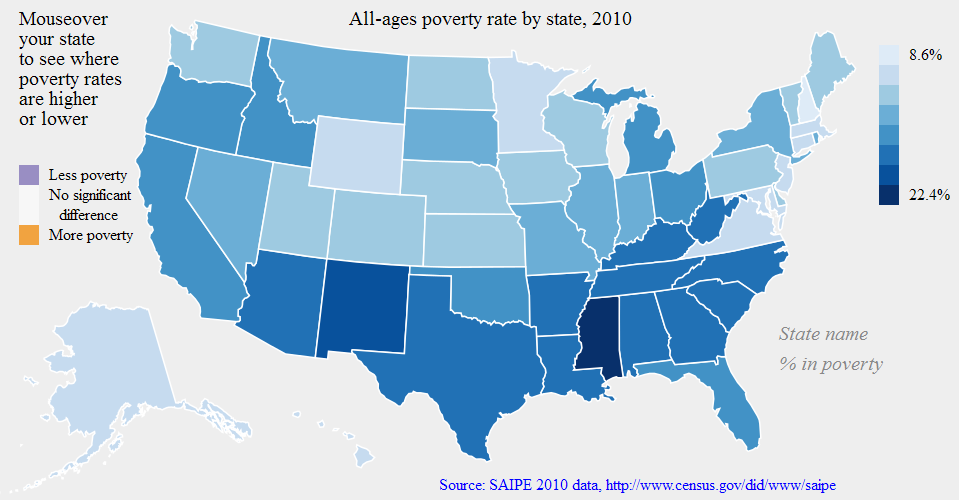
I’ve updated the interactive poverty map from last month, providing better labels, legends, and a clickable link to the data source. It also actually compares confidence intervals correctly now. I may have switched the orange and purple colors too. (I also reordered the code so that things are defined in the right order; I think that was why sometimes you’d need to reload the map before the interactivity would work.)

Please click the screenshot to try the interactive version (seems to work better in Firefox than Internet Explorer):

Next steps: redo the default color scheme so it shows the states relative to the national average poverty rate; figure out why there are issues in the IE browser; clean up the code and share it on Github.
[Edit: the IE issues seem to be caused by D3’s use of the SVG format for its graphics; older versions of IE do not support SVG graphics. I may try to re-do this map in another Javascript library such as Raphaël, which can apparently detect old versions of IE and use another graphics format when needed.]

For lack of a better term I’m still using “idiopleth”: idio as in idiosyncratic (i.e. what’s special about this area?) and pleth as in plethora (or choropleth, the standard map for a multitude of areas). Hence, together, idiopleth: one map containing a multitude of idiosyncratic views. Please leave a comment if you know of a better term for this concept already.

Getting SASsy

Although I am most familiar with R for statistical analysis and programming, I also use a fair amount of SAS at work.

I found it a huge transition at first, but one thing that helped make SAS “click” for me is that it was designed around those (now-ancient) computers that used punch cards. So the DATA step processes one observation at a time, as if you were feeding it punch cards one after another, and never loads the whole dataset into memory at once. I think this is also why many SAS procedures require you to sort your dataset first. It makes some things awkward to do, and often it takes more code than the equivalent in R, but on the other hand it means you can process huge datasets without worrying about whether they will fit into memory. (Well… memory size should be a non-issue for the DATA step, but not for all procedures. We’ve run into serious memory issues on large datasets when using PROC MIXED and PROC MCMC, so using SAS does not guarantee that you never have to fear large data.)

The Little SAS Book (by Delwiche and Slaughter) and Learning SAS by Example (by Cody) are two good resources for learning SAS. If you’re able to take a class directly from the SAS Institute, they tend to be taught well, and you get a book of class notes with a very handy cheat sheet.

Great work in math education (through blogs and Star Wars)

I keep emailing these links to friends, so I might as well put them in an update-able post instead.

I got hooked by this line:

You say “looks like somebody has too much time on their hands” but all I hear is “I’m sad because I don’t know what creativity feels like.”

I love this mentality and followed it down the path to an excellent community of high school math/physics teachers, all blogging about how they try to keep students engaged, motivate the topics they teach, make grades meaningful, etc. Two of my favorites are Shawn Cornally and Dan Meyer:

Shawn Cornally‘s all about formative assessment, standards-based grading, learning through inquiry, etc. Definitely watch his TEDx talk (with Star Wars references, as promised; I love the part about “Tayh D Be”) and check out the formative assessment / feedback / grading tool he’s built.

Dan Meyer takes a love of storytelling (compare the narrative of Star Wars to a typical math problem) and sets up some badass perplexing math questions, using good hooks to get students engaged AND using the real world as an answer key (vs. just “Oh that’s what the back of the book says”).

Also recommended is another TEDx talk by physics teacher / skateboarder Dr Tae.

Here is an overview of some other discussions in this math-teacher blogosphere. That includes some back-and-forth on Khan Academy, which I think is doing great work but I agree with the criticism that his videos can come across as “This is a required class, so let me help you pass the quiz,” instead of “This is an awesome subject, so let me get you hooked on it.” It’s much better than nothing, but there’s room for even more goodness…

Plenty of other great great blogs to share, but that’s a start for now.

Matrix vs Data Frame in R

Today I ran into a double question that might be relevant to other R users:
Why can’t I assign a dataframe row into a matrix row?
And why won’t my function accept this dataframe row as an input argument?

A single row of a dataframe is a one-row dataframe, i.e. a list, not a vector. R won’t automatically treat dataframe rows as vectors, because a dataframe’s columns can be of different types. So converting them to a vector (which must be all of a single type) would be tricky to generalize.

But if in your case you know all your columns are numeric (no characters, factors, etc), you can convert it to a numeric matrix yourself, using the as.matrix() function, and then treat its rows as vectors.

> # Create a simple dataframe
> # and an empty matrix of the same size
> my.df <- data.frame(x=1:2, y=3:4)
> my.df
  x y
1 1 3
2 2 4
> dim(my.df)
[1] 2 2
> my.matrix <- matrix(0, nrow=2, ncol=2)
> my.matrix
     [,1] [,2]
[1,]    0    0
[2,]    0    0
> dim(my.matrix)
[1] 2 2
>
> # Try assigning a row of my.df into a row of my.matrix
> my.matrix[1,] <- my.df[1,]
> my.matrix
[[1]]
[1] 1

[[2]]
[1] 0

[[3]]
[1] 3

[[4]]
[1] 0

> dim(my.matrix)
NULL
> # my.matrix became a list!
>
> # Convert my.df to a matrix first
> # before assigning its rows into my.matrix
> my.matrix <- matrix(0, nrow=2, ncol=2)
> my.matrix[1,] <- as.matrix(my.df)[1,]
> my.matrix
     [,1] [,2]
[1,]    1    3
[2,]    0    0
> dim(my.matrix)
[1] 2 2
> # Now it works.
>
> # Try using a row of my.df as input argument
> # into a function that requires a vector,
> # for example stem-and-leaf-plot:
> stem(my.df[1,])
Error in stem(my.df[1, ]) : 'x' must be numeric
> # Fails because my.df[1,] is a list, not a vector.
> # Convert to matrix before taking the row:
> stem(as.matrix(my.df)[1,])

  The decimal point is at the |

  1 | 0
  1 |
  2 |
  2 |
  3 | 0

> # Now it works.

For clarifying dataframes vs matrices vs arrays, I found this link quite useful:
http://faculty.nps.edu/sebuttre/home/R/matrices.html#DataFrames

Director Groves leaving Census Bureau

I’m sorry to hear that our Census Bureau Director, Robert Groves, is leaving the Bureau for a position as provost of Georgetown University. The Washington Post, Deputy Commerce Secretary Rebecca Blank, and Groves himself reflect on his time here.

I have only heard good things about Groves from my colleagues. Besides the achievements listed in the links above, my senior coworkers tell me that the high number and quality of visiting scholars / research seminars here, in recent years, is largely thanks to his encouragement. He has also set a course for improving the accessibility and visualization of the Bureau’s data; I strongly hope future administrations will continue supporting these efforts.

Finally, here is a cute story I heard (in class with UMich’s Professor Steven Heeringa) about Groves as a young grad student. I’m sure the Georgetown students will enjoy having him there:

“In the days in ’65 when Kish’s book was published, there were no computers to do these calculations. So variance estimation for complex sample designs was all done through manual calculations, typically involving calculating machines, rotary calculators.

I actually arrived in ’75 as a graduate student in the sampling section, and they were still using rotary calculators. I brought the first electronic calculator to the sampling section at ISR, and people thought it was a little bit of a strange device, but within three months I had everybody convinced.

Otherwise we had these large rotary calculators that would hum and make noise, and Bob Groves and I — there was a little trick with one of the rotary calculators: if you pressed the correct sequence of buttons, it would sort of iterate and it would start humming like a machine gun, and so if you can imagine Bob Groves fiddling around on a rotor calculator to sorta create machine gun type noises in the sampling section at ISR… I’m sure he’d just as soon forget that now, but we were all young once, I guess.”

Dr Groves, I hope you continue to make the workplace exciting 🙂 and wish you all the best in your new position!