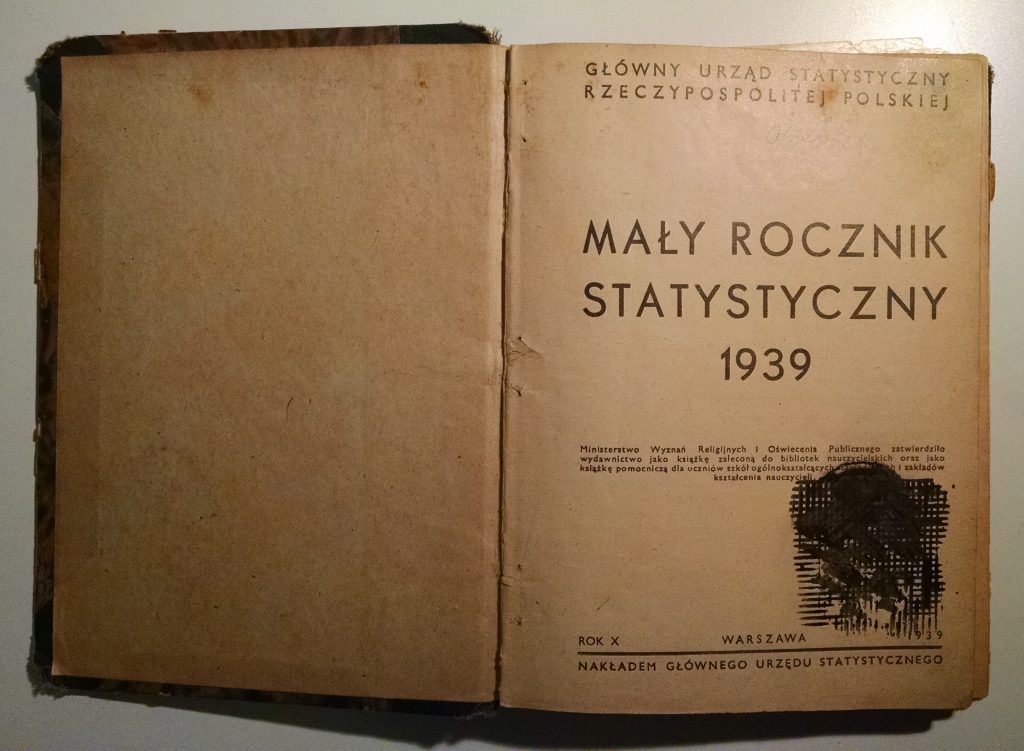
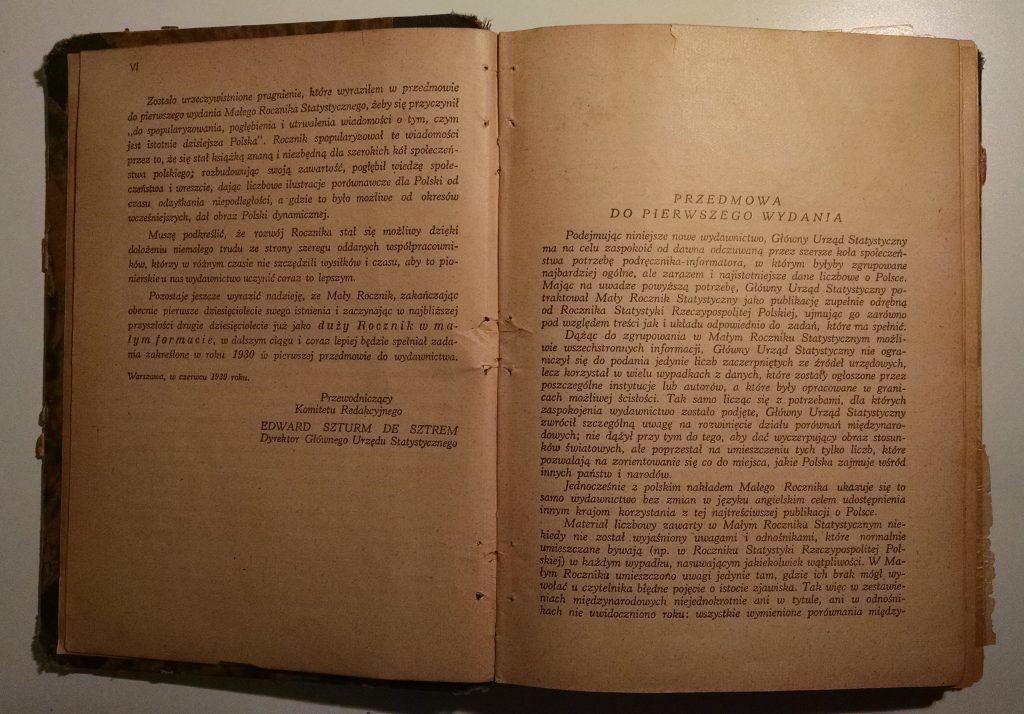
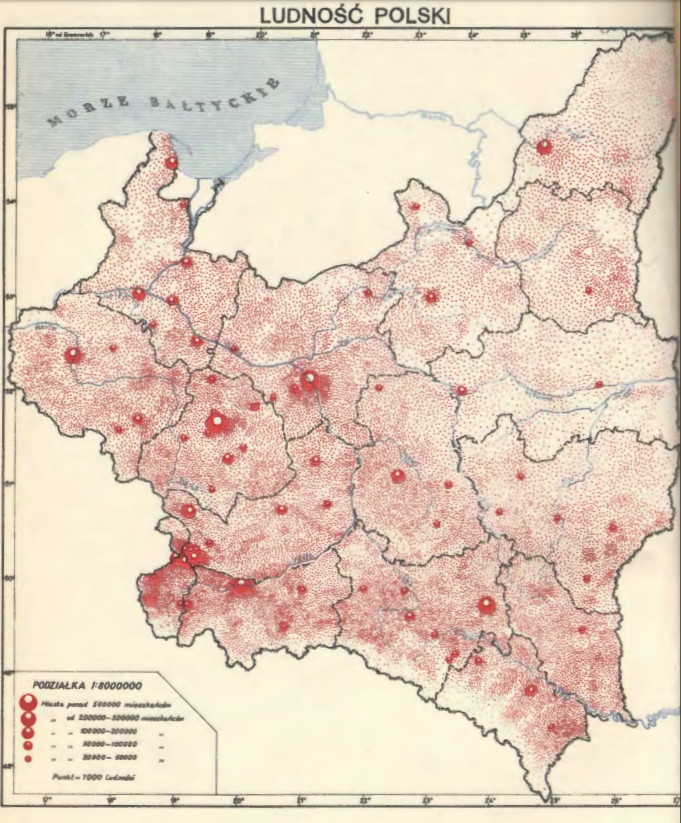
Listen. I want to tell you about someone who spoke up when the stakes were high. It was 1939, the start of World War 2, in Poland. Life-or-death stakes—and I mean that literally.
I want to tell you about my great-grandmother.
Now, here in 2025 I’m hearing quite a few reports of courageous civil servants, lawyers, judges, and others standing up to the firehose of this presidential administration’s illegal orders and actions. Unfortunately, many of our representatives in the US House and Senate don’t seem to have the courage to speak up, nor to vote against the wannabe strongman in charge, despite the fact that the consequences for speaking up are still (for now) remarkably low. Absurdly low, in historical perspective. From a 2020 article in The Atlantic, but still true today:
Poles like Miłosz wound up in exile in the 1950s; dissidents in East Germany lost the right to work and study. In harsher regimes like that of Stalin’s Russia, public protest could lead to many years in a concentration camp; disobedient Wehrmacht officers were executed by slow strangulation.
By contrast, a Republican senator who dares to question whether Trump is acting in the interests of the country is in danger of—what, exactly? Losing his seat [after serving out the rest of his term] and winding up with a seven-figure lobbying job or a fellowship at the Harvard Kennedy School? […]
They are scared not of prison, the official said, but of being attacked by Trump on Twitter. They are scared he will make up a nickname for them. They are scared that they will be mocked, or embarrassed, like Mitt Romney has been. They are scared of losing their social circles, of being disinvited to parties.
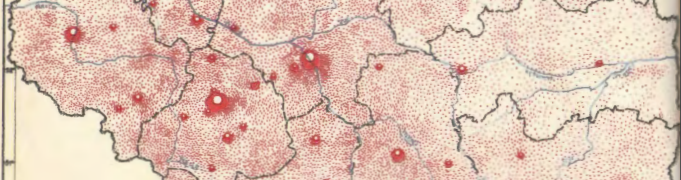
In contrast to our cowards in the House and Senate today, please let me tell you about my mom’s dad’s mom: Janina Eckert. In September of 1939, on the eve of WWII, my grandfather Marian was 7 years old. As the German forces invaded Poland and started WWII, they bombed the city where my grandfather lived with his mother (his father was deeply ill with tuberculosis and convalescing at a sanatorium). Janina fled with her son (my grandfather), as well as her sister and niece, to the smaller town of Mogilno, where Janina’s brother Kazimierz had owned a pharmacy. However, great-uncle Kazimierz had already fled to the east, correctly guessing that he must be on Nazi blacklists because he had already fought to defend Poles on the Polish-German border.
Here I quote from the family history that my grandfather wrote down for us:
[The family] stood helplessly in front of the locked pharmacy. Luckily it turned out that the uncle had left spare keys with his assistant, the young pharmacist in training. He allowed the two sisters with their children into the apartment and left them with a key to the pharmacy. […]
And then suddenly the Germans appeared, greeted enthusiastically by the German ethnic minority of Mogilno. Soon they also came to the pharmacy to ask about the pharmacist [Kazimierz]. When nobody could speak to his whereabouts, they demanded that the mother and aunt must open the pharmacy and sell basic medicines. They took the young apprentice with them. Then they began arresting Mogilno’s citizens, according to the blacklist. Soon there appeared notices of execution, by the authorities, of special persons who had mounted an armed defense of the city […] On September 11th they brought to Mogilno’s town square 34 condemned people, including the apprentice pharmacist.
Out of the exhausted crowd [Janina] stood up. She spoke German well and started convincing the Germans that losing their only pharmacist would also mean a lack of pharmaceutical aid for the town’s German population. After a short exchange, they dragged the young man in the white shirt out of the queue and commanded him to return to the pharmacy.
For years after the war, this man would visit [her home], always on September 11th, with a bouquet of red-and-white roses for Janina Eckert.
Picture it, if you can. Great-grandma Janina was in an actual war zone. She was responsible for a young child (and sister and niece). Awaiting a literal public execution in the town square, with armed Nazi on all sides, she could have stayed meek and quiet and tried to protect her child by avoiding the occupiers’ attention. But instead, she stuck her neck out. She couldn’t save everyone, but she spoke up and managed to save at least one person. In fact, by saving the pharmacist, she helped the whole town—even those German residents who hated Poles like her.
Here in 2025, I’m trying to figure out what I can do to live up to great-grandma Janina’s example. The very least I can do is call and write to my representatives and attend protests. I live in Maine, where one of my representatives is Republican Senator Susan Collins, who makes a big show of claiming to be moderate but consistently votes with Trump anyway.
Senator Collins, please take note of Janina’s story. That’s how it’s done. When are you going to stand up for Mainers? For Americans? For the rule of law? Or will you merely be quietly “concerned” until it’s much too late?