Winter is coming (to the Broad Street pump)

We live in an amazing future, where an offhand Twitter joke about classic data visualizations and Game of Thrones immediately turns into a real t-shirt you can buy.

You know nothing (about cholera), John Snow

Hats off to Alberto Cairo (whose book The Functional Art and blog are the best introductions to data visualization that I can recommend—but you already knew that).

If you don’t already know the story of John Snow and the Broad Street pump—or if you think you do but haven’t heard the full details—then The Ghost Map is a great telling.

Update: Alberto continues to kick this up a notch, adding two more Game Of Thrones-themed classic dataviz jokes, and making the images/captions available under the Creative Commons license. Awesome.

Winter is coming (for Napoleon)

After 2nd semester of Statistics PhD program

Here’s another post on life as a statistics PhD student (in the Department of Statistics, at Carnegie Mellon University, in Pittsburgh, PA).
The previous such post was After 1st semester of Statistics PhD program.

Classes:

  • I feared that Advanced Probability Overview would be just dry esoteric theory, but Jing Lei ensured all the topics were really well-motivated. Although it was tough, I did better than I’d hoped (especially given that I’ve never taken a proper Real Analysis course). In Statistical Machine Learning, Larry Wasserman and Ryan Tibshirani did a great job of balancing “old” core theory with new cutting-edge research topics, including helpful homework assignments that gave us practice both in theory and in applications.
  • My highlight of the semester was being able to read and digest a research paper that was way too abstract when I tried reading it a few years ago. It really hit me that I must be learning something in grad school ๐Ÿ™‚
    (The paper was Building Consistent Regression Trees from Complex Sample Data, by Toth and Eltinge. While working at Census, I wanted to try running a complex-survey-weighted regression tree, but I couldn’t get much out of this paper. Now, after a good dose of probability theory and machine learning, it’s far clearer. In fact, I have some ideas about extending this work!)
  • The Statistical Machine Learning class referenced a ton of crazy math terms I wasn’t familiar with: Banach and Hilbert spaces, Lp norms, conjugate functions, etc. It terrified me at first—I’ve never even heard of this stuff, should I have taken grad-level functional analysis before I started this PhD, am I about to fail?!?—but it turns out a lot of it is just names for specific versions of general concepts that I already knew. Whew. Also, most of it got used repeatedly from topic to topic, so we did gain familiarity even without explicitly taking a functional analysis course etc. So, don’t get disheartened too easily by unfamiliar terminology!
  • It was great to finally learn more about Lp norms and about splines. Also, almost everything in SML can be written as a penalized regression ๐Ÿ˜›
  • Smoothing splines and Reproducing Kernel Hilbert Space (RKHS) regression are nifty because the setup is that you want to optimize over all possible functions. So you start out with an infinite-dimensional space, for which in general there might be no simple way to search/optimize! … But in these specific setups, we can prove that the optimal solution happens to lie in a finite-dimensional subspace, where your usual optimization/search tools will work after all. Nice.
  • Larry had a nice “foundations” day in SML, with examples where Bayes and Frequentist analysis differ greatly. However, I didn’t find most of his examples too convincing, since the Bayesian “loses” only due to a stupid choice of priors; or the Bayesian “loses” for finite n but in a case where n in practice would have to be ridiculously large. Still, this helped stretch my thinking about how these inference philosophies differ.
  • Larry points out: you often hear that “We might as well go Bayes because if you give people a Frequentist interval, they’ll interpret it as a Bayes interval.” But the reverse is also true: Give someone a sequence of 95% Bayes intervals, and they’ll expect 95% of them to contain the true value. That is NOT necessarily going to happen with Bayes CIs (unlike Frequentist CIs).
  • In addition to Subjective, Objective, Empirical, or Calibrated Bayes, let me propose “Cynical Bayes”: Don’t choose a prior because you believe it. Instead, choose one to optimize your estimator’s Frequentist properties. That way you can keep your expert Freq’ist colleagues happy, yet still call it a Bayes estimator, so you can give the usual Bayes interpretation to keep nonexperts happy ๐Ÿ™‚
  • A background in Statistics will keep you thinking about distributions and probabilities and convergences. But a background in Applied Math may be better at giving you tools and ideas for feature engineering. It’s worth having both toolsets.
  • The Advanced Probability Overview course covered some measure-theoretic probability. I’m finally understanding the subtleties of how the different convergences \xrightarrow{p}, \xrightarrow{as}, \xrightarrow{D}, and \xrightarrow{L^p} all differ, and why it matters. We saw these concepts last semester in Intermediate Statistics, but the distinctions are far clearer to me now.
  • AdvProb’s measure theory section also really helped me understand why textbooks say a random variable is a “function”: intuitively it seems like just a variable or a number or something… but in fact it really is a function, from “the state of the world” i.e. an element \omega of the set \Omega of all possible outcomes or states of the world, to the measurement you will collect (often a number on the real line). Finally, this measure theory view of probability, as the size of a subset of \Omega, is helpful. Even though statisticians’ goal is to develop tools that let them work with the range of the random variable and ignore the domain \Omega, it’s good to remember that this domain exists.
  • However, measure theory and probability theory suffer from some really poor terminology! For example, it took me far too long to realize that “integrable” means “the integral is finite”, NOT “the integral exists.”
  • When we teach students R, we really should use practical examples, not the arbitrary generic examples that you see so often. Instead of just showing me list(1,"a"), it helps to give a realistic example of why you may actually need to collect together numeric and character elements in a single object.

Research:

  • I started a new research project, the Advanced Data Analysis project, which will run until the end of this upcoming Fall semester (so about a year total). I am working with Rob Kass and Avniel Ghuman on using magnetoencephalography (MEG) data to study epilepsy.
  • At Rob’s research group meetings, I learn a ton from the helpful questions he asks. When presenting someone else’s work (i.e. for a journal club), ask yourself, “What would you do if *your* research was based on the data from this paper?” Still, I’ve found I really do need to keep scheduling weekly 1-on-1 meetings—the group meetings are not enough to stay optimally on track.
  • Neuroscience is hard! Pre-processing massive neuroscience datasets using not-fully-documented open source software is particularly hard. When I chose this project, I did not realize how much time I would have to spent on learning the subject matter, relevant specialized software tools, and data pre-processing workflow. Four months in and I’ve still barely gotten to the point of doing any “real” statistics. It’s a good project and I’m learning a lot, but it’s disheartening to see how much of that learning has been tied to debugging open-source software installations that I’ll only ever use again if I stay in this sub-field.
    I would advise the next PhD cohort to choose projects that’ll primarily teach you more general-purpose, transferable skills. Maybe take an existing theoretical method that’s not implemented in software yet, and make it into an R package?

Life:

  • This was a tougher semester in many ways, with harder classes and more research-related setbacks. The Cake song Tougher than it is got a lot of play time on my headphones ๐Ÿ˜›
  • I’m glad that despite my slow posting rate, the blog still kept getting regular traffic—particularly Is a Masterโ€™s degree in Statistics worthwhile? I guess it’s a burning question these days.
  • A big help to my sanity this semester came from joining the All University Orchestra. After a long week of tough classes and research setbacks, it’s great to switch brain modes and play my clarinet. I’ve really missed playing for the past few years in DC, and I’m glad to get back into it.
  • Pittsburgh highlights: Bayernhof museum, Pittsburgh Symphony Orchestra concerts (The Legend of Zelda, “Behind the Notes” talks), Jozsa Corner, Point Brugge Cafe, sampling all the Squirrel Hill pizzerias, MCMC Bar Crawl on the Southside Flats, riding the ridiculously steep inclines, Pittsburgh Area Theater Organ Society concerts and tours of their beautiful theater organ
  • Things still on our list to do in Pittsburgh: see a CMU theater performance, Pittsburgh aviary and zoo, Kennywood amusement park, Steelers game, Penguins game
  • I look forward to getting a chance to teach a whole course this summer. It’ll be 36-309, Experimental Design. I also took some Eberly Center seminars, and the department organized helpful planning meetings for those of us students who’ll teach in the summer, so I feel reasonably prepared.
    I plan to have my students design a series of experiments to bake the ultimate chocolate chip cookie. It will be delicious. I baked Meg Hourihan’s mean chocolate chip cookies for a department event earlier this spring, which seems like an appropriate start.
    However, ironically, as the local knitr / reproducible research fanboy… I’m supposed to teach the course using SPSS, which seems to be largely point-and-click, without much support for reproducible reports ๐Ÿ™
  • It was a nice difference to be on the other side of the department’s open house for admitted students this year ๐Ÿ™‚ I’m also happy to be reading Grad Cafe forums from a much more relaxed point of view this year!
  • I’m surprised there’s not much crossover between the CMU and UPitt statistics departments. And the stats community outside each department doesn’t seem as vibrant as it was in DC. I attended the American Statistical Association’s Pittsburgh chapter banquet. Besides CMU and Pitt folks, most attendees seemed to be RAND employees or independent consultants. There are also some Meetup groups: the Pittsburgh Data Visualization Group and the Pittsburgh useR Group.
  • I’ve updated and expanded my CMU blogroll in the sidebar. Please let me know if I missed your CMU/Pittsburgh statistics-related blog!

Other people’s helpful posts on the PhD experience:

Next up: the 3rd, 4th, 5th, 6th, 7th, 8th, 9th, and 10th semesters of my Statistics PhD program.

‘Census Marketing’ app by Olin College students

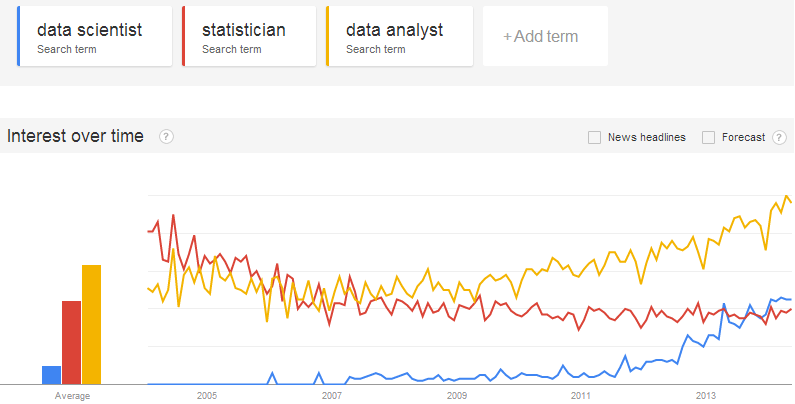
I love having the chance to promote nifty data visualizations; good work from my former employer, the Census Bureau; and student projects from my alma mater, Olin College. So it’s a particular pleasure to highlight all three at once:

Elizabeth Duncan and Marena Richardson, students in Olin’s Data Science course, teamed up with Census staff and BusinessUSA to develop an app that helps make Census data accessible to small business owners.

CensusMarketing

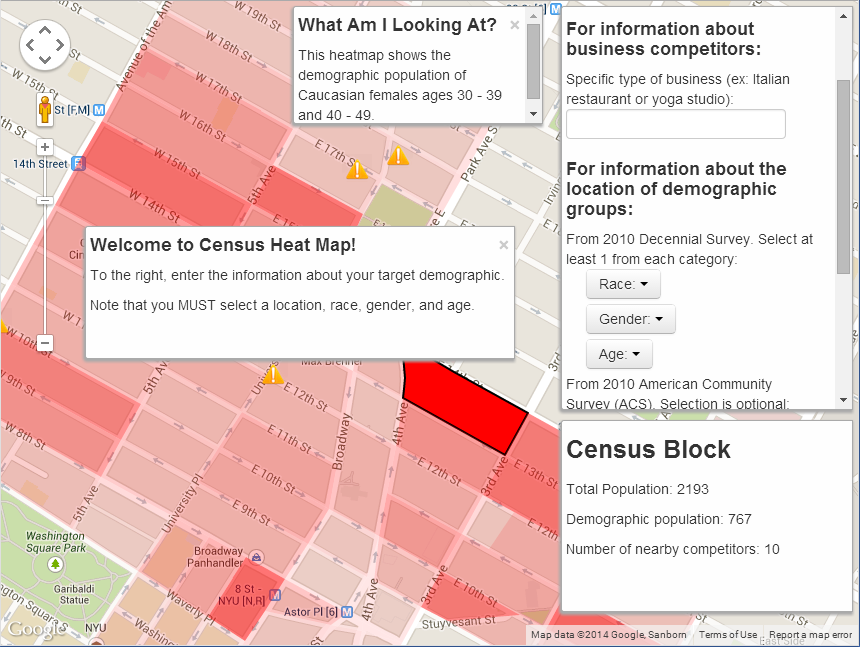
The result, Census Marketing, is a nifty and simple interface to overlay Decennial Census and American Community Survey data on Google Maps.

Imagine you’re planning to start or expand a small business, and you know the demographic you’d like to target (age, income, etc.) Where in your town is there a high concentration of your target market? And, are there already competing businesses nearby?

Load up Duncan and Richardson’s website, enter your location, select demographic categories from a few drop-down menus, and give your business type. The app will go find the relevant data (through the Census API) and display it for you as a block-level heatmap on Google Maps. It’ll also highlight the locations of existing businesses that might be competitors.

For example, say you want to open a pizzeria in my Pittsburgh neighborhood of Squirrel Hill. You might want to target the undergrad and grad student populations, since they tend to order pizza pretty often. Punch in the zip code 15217, choose all races and both sexes, select age groups 20-29 and 30-39, and specify that you’re looking for other competing pizzerias:

CensusMarketing_SqHillPizza

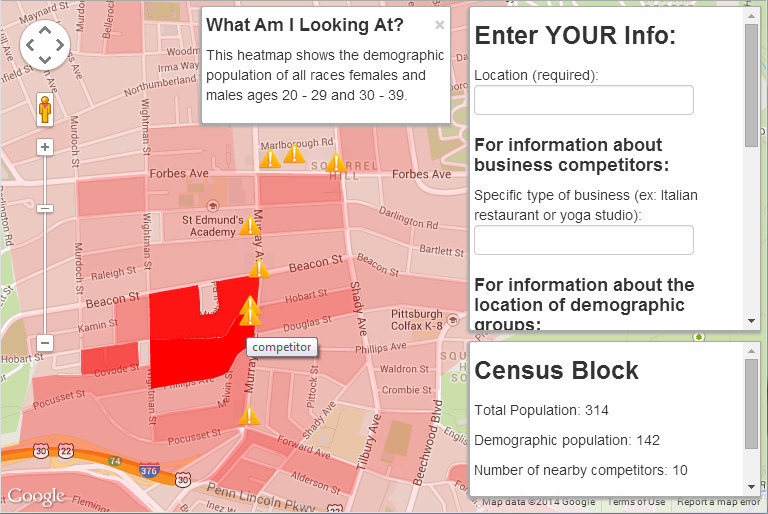
Well! The student-age population is clearly concentrated around Hobart and Murray… but so are the competing pizzerias. Good to know. Maybe you need to brainstorm a new business plan, seek out a different part of town, or try marketing to a different demographic.

Besides learning about data science and creating a website, Duncan and Richardson also interviewed several actual small business owners to refine the user experience. It’s a nice example of Olin’s design-centered approach to engineering education. I can imagine a couple of further improvements to this app… But it’s already a nice use case for the Census API, and a good example of the work Olin students can do in a short time.

PS—the course instructor, Allen Downey, has a free book ThinkStats on introductory statistics from a computer scientist’s point of view. I hear that a revised second edition is on its way.

Other students’ views on CMU’s Statistics department

(1) There are a couple of nice posts on Quora answering “What is it like to be a graduate student in Statistics at CMU?”
(If you don’t want to sign in to Quora, you might be able to read the replies through these direct links: Jack, Alex, Sangwon.)

(2) When I was applying to schools, a fellow PhD student here shared his thoughts about CMU’s Statistics department. He kindly allowed me to share his comments here as a guest post, though he warns it may be a year or two out of date.

In probably all graduate programs, but at least at CMU, graduate study consists of a coursework component and a research component. (You can see the curriculum here, and while they keep tweaking it, this looks like it’s more or less up to date.) As you can see, the balance starts out tilted heavily toward coursework and gradually starts to shift toward research, so that by your fourth semester you are mostly doing research. This makes sense – it would be tough to do much research-wise without at least some foundational methodological and theoretical training.

A key component of the easing-in process is the well-designed but not particularly well-named Advanced Data Analysis (“ADA”) course, which is a yearlong project spanning your second and third semesters. In this, you choose a professor to work with (they all give presentations about their work first semester to give you a sense of whom to choose), and this professor arranges a relationship with an outside investigator — a “real scientist”, not a statistician, usually in some other department at CMU or Pitt — who has data for you to analyze. Then the three (or more) of you work on the problem of analyzing that data for a year, meeting relatively frequently to discuss progress and whatever issues may arise. You also produce reports and presentations on the project as milestones.

So I’m now at the beginning of my second year, in the midst of my ADA project as well as the Advanced Stat Theory class. To give you a sense of an ADA project, I am working with two professors from Stats and one from CMU Astrophysics on a data set consisting of galaxies, trying to develop predictive models for galaxy redshift purely by analyzing these images. Other ADA projects right now include applications to educational testing, the genetic basis of autism, and medical studies of dementia.

So with that said, while I’m not in the full-blown research part of the PhD, I’ve still had the opportunity to work closely with professors and it has been very fruitful. They tend to be accessible and willing to meet as often as I want to, which tends to be once a week or every other week. My experience with research is that we’ll meet and talk about stuff, then I’ll go home and try whatever new stuff is suggested, and when I have something to show or have hit a wall, we meet again to talk about it. I’ve also started going to the meetings of the Astrostatistics group, which is a collaborative research effort between CMU Stats, CMU Astrophysics, and Pitt Astronomy, and hearing about all the research that’s being done in that setting.

I think the way CMU structures the research experience speaks to how much emphasis it places on acclimating you to that environment, which is really quite different from the classroom. Regarding the coursework component, most of the classes I’ve had here have been well-taught, and the professors hold office hours and generally welcome student inquiry. I think the professors, for the most part, do an admirable job of juggling their research and teaching without short-changing one piece or the other. I’ve definitely learned a ton from classes, which is important because my background in statistics was rather weak coming in. (I had a solid foundation in Math and CS, but not a ton of exposure to Stats.)

Regarding the distinguishing qualities of the program, there are a few. Among the spectrum of theoretical vs. applied programs, it tends to skew applied — there are a few people doing theory but many more working on applications to various fields. (This could be a good thing or a bad thing depending on your taste.) But if you ask people here, they might say the distinction between theoretical and applied work is kind of silly, since advances in theory can yield new methodology and novel applications can motivate development of theory. But anyhow, given that professors do a lot of applied work, there are fertile collaborations here with quite a few disciplines — astrostatistics as I mentioned, neuroscience, CS/machine learning, genetics, even some people working on finance/economics problems. So it’s not limiting at all in terms of what you can work on.

Another good thing about the program is that it’s pretty current and (you might say) somewhat pragmatic. For instance, they just revamped our Advanced Stat Theory core course to be taught with a huge focus on nonparametric inference instead of the canonical/classical inference theory, because it turns out that most people in real-world research settings are using nonparametric methods much more. In general, it’s great when a department recognizes that a field is evolving (rapidly!) and they are willing to adapt to cover what will be useful for students rather than what they became famous for writing books about in the ’70s.

That’s all I can think of now. Best of luck with the application process!

More on graduate study for careers in Statistics

First, the Science career magazine has a good article, “Careers in Statistics Evolve and Expand,” with job growth projections and a few interviews. However, there’s not much direct advice on how to land one of these jobs.

Meanwhile, I’ve received a couple more emails asking how best to prepare for Statistics careers. If you’re an employer, or a recent graduate, do you have any advice to share?

First email:

I am working in the area of cancer research. After spending some time doing clinical data analysis and working on genomics, I realized data analysis is something I really enjoy. I have already started learning Python and R. But considering my background and no proper academic training in math/stat, how do I go about getting a job in industry related to big data? Do you think getting a Master’s would help? Even for Master’s I would need undergrad courses in Math/Lin Algebra.

My response:

Python and R are great tools to work with, so it’s good that you’ve been learning those.

What kind of big data jobs are you interested in? Unfortunately, I don’t have too much advice about industry jobs, since my time has been mostly in government and academia.*

In general, I think there’s great value in having a rigorous statistics background when doing data analysis, so that you know the limitations of your data and your conclusions. However, some employers might prefer you to have expertise in fast algorithms or big-data tools like Hadoop (which most statistics Masters programs don’t really cover). If you’d like to work in such positions, you may prefer to focus on learning programming or computer science.

If you do go for a Masters in statistics, you will definitely want to brush up on calculus and linear algebra. These mathematical foundations are needed for stating (and proving) core concepts in statistics.

Second email:

My undergraduate degree is in a humanities field, but I have been taking computer science, stats, and math courses so that I could apply to either a Masters in Comp Sci or in Statistics. I really enjoy stats, and I have done well in all of my stats classes, including a graduate level course. It also fits in well with my interest in information and how to understand and manipulate it in order to make it understandable.

I feel like my interests and background make the Applied Statistics degree more what I am looking for. I am also thinking that the online option might be a good idea because it would allow me to build my contacts through part-time work or internships.

Anyways, since you have such as varied background, I am wondering what your thoughts are on the professional Masters in Applied Statistics program and whether it would be a way for me to get into the stats field, or if it is looked down on by employers? Also, what do you think of the residency vs. online options?

And my response:

Do you know what you’d like to do in statistics, once you have the degree? Are you interested in academia, industry, consulting, government, healthcare, etc?

My work experience was in government, where the hiring standards are pretty explicit. For example, most Masters programs would prepare you well for work at the Census Bureau at the GS-09 grade level, as I did with my Masters. Here’s the job posting and other related opportunities. As long as the online program is properly accredited, the fact that it’s online shouldn’t matter for government jobs.

But I don’t have much experience with industry jobs, and hiring there has changed a lot in the 5 years since I last applied for jobs.* Google searches for “data scientist” only picked up around 2012 ๐Ÿ™‚

GoogleTrendsDataSci

Finally, just in case you haven’t taken online courses before, I’d recommend trying some before you sign up for an all-online degree. Personally I’ve found I learn much better when I come to class regularly and talk to professors in person. But if that’s not an issue for you, then it sounds great to have the flexibility to do part-time work or internships. That kind of practical experience should help a lot on the job hunt too.

*Clearly, I should really ask one of our recent graduates from CMU’s 1-year Masters in Statistical Practice to write a post about their experience on the job hunt this semester. They’d have a much better idea of how prospective employers today look at stats Masters degrees.

Related posts:

For CMU specifically:

Barkov Chain Monte Crawlo

Finally, another semester over. I’ll post my 2nd-semester reflections soon… but meanwhile, who wants to grab a drink?

If you’re in Pittsburgh this Saturday, come join me and my classmates for a pub crawl, at the South Side bars on E Carson St (around 11th to 22nd St). We plan to start at The Library (2302 East Carson St) around 5:30 or 6pm, and go from there. If you come later, I’ll try to update our location here or on Twitter with hashtag #statbeer.

The plan:

Although I can’t claim originality (a web search turns up this), I believe I came up with this independently: I propose using Markov Chain Monte Carlo (MCMC) to stage a bar crawl and/or using the bar crawl metaphor to explain MCMC.

The MCMC Bar Crawl* (a.k.a. Barkov Chain Monte Crawlo) is simple:

  1. We randomly propose a nearby bar to visit
  2. We vote: how many people like that bar better than where we are now?
  3. If it’s not unanimous, roll a die to see whether we stay here or move there
  4. Have a drink and repeat

* (Basically a Metropolis sampler from the multinomial distribution on our bar preferences.)

Update: this was a success and we’ll do it again. See also SMBC’s Bayesian Drinking Game.