Graph Design for the Eye and Mind, Stephen Kosslyn

When I reviewed The Grammar of Graphics, Harlan Harris pointed me to Kosslyn’s book Graph Design for the Eye and Mind. I’ve since read it and can recommend it highly, although the two books have quite different goals. Unlike Wilkinson’s book, which provides a framework encompassing all the graphics that are possible, Kosslyn’s book summarizes perceptual research on what makes graphics actually readable.

In other words, this is something of the graphics equivalent to Strunk and White’s The Elements of Style, except that Kosslyn’s grounded in actual psychology research rather than personal preferences. This is a good book to keep at your desk for quickly checking whether your most recent graphic follows his advice.

Kosslyn is targeting the communicator-of-results, not the pure statistician (churning out graphs for experts’ data exploration) or the data artist (playing with data-inspired, more-pretty-than-meaningful visual effects). In contrast to Tukey’s remark that a good statistical graphic “forces us to notice what we never expected to see,” Kosslyn’s focus is clear communication of what the analyst has already notices.

For present purposes I would say that a good graph forces the reader to see the information the designer wanted to convey. This is the difference between graphics for data analysis and graphics for communication.

Kosslyn also respects aesthetics but does not focus on them:

Making a display attractive is the task of the designer […] But these properties should not obscure the message of the graph, and that’s where this book comes in.

So Kosslyn presents his 8 “psychological principles of effective graphics” (for details, see Chopeta Lyons’ review or pages 4-12 of Kosslyn’s Clear and to the Point). Then he illustrates the principles with clear examples and back them up with research citations, for each of several common graph types as well as for labels, axes, etc. in general. I particularly like all the paired “Don’t” and “Do” examples, showing both what to avoid and how to fix it. Most of the book is fairly easy reading and solid advice. Although much of it is common sense, it’s useful as a quick checkup of the graphs you’re creating, especially as it’s so well laid-out.

Bonus: Unlike many other recent data visualization books, Kosslyn does not completely disavow pie charts. Rather, he gives solid advice on the situations where they are appropriate, and on how to use them well in those cases.

If you want to dig even deeper, Colin Ware’s Information Visualization is a very detailed but readable reference on the psychological and neural research that underpins Kosslyn’s advice.

The rest of this post is a list of notes-to-self about details I want to remember or references to keep handy… Bolded notes are things I plan to read about further. Continue reading Graph Design for the Eye and Mind, Stephen Kosslyn”

The Grammar of Graphics: notes on first reading

Leland Wilkinson’s The Grammar of Graphics is a classic in the data visualization literature. Wilkinson created a framework that coherently ties together many aspects of designing, implementing, reading, and understanding a graphic. It’s a useful approach and has been fairly influential: The popular R package ggplot2 is, more or less, an implementation of Wilkinson’s ideas, and I also see their influence in the software Tableau (about which more another time). Wilkinson himself helped to build these ideas into SPSS’s Graphics Production Language (GPL) and then SPSS Visualization Designer.

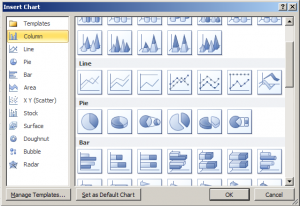
So what’s so special here? One of the core ideas is to start with the raw data and think about all the transformations, summaries, etc. that go into graphing it. With a good framework, this can help us see connections between different graphs and create new ones. (The opposite extreme is a “typology” or list of graph types, like you get in Excel: do you want a bar chart, a pie chart, a line chart, or one of these other 10 types? Such a list has no deep structure.) Following Wilkinson’s approach, you’ll realize that a pie chart is basically just a stacked bar chart plotted in polar coordinates, with bar height mapped to pie-slice angle… and that can get you thinking: What if I mapped bar height to radius, not angle? What if I added a variable and moved to spherical coordinates? What if I put a scatterplot in polar coordinates too? These may turn out to be bad ideas, but at least you’re thinking — in a way that is not encouraged by Excel’s list of 10 graph types.

This is NOT the approach that Wilkinson takes.

But, of course, thinking is hard, and so is this book. Reading The Grammar of Graphics requires much more of a dedicated slog than, say, Edward Tufte’s books, which you can just flip through randomly for inspiration and bite-sized nuggets of wisdom. (I admire Tufte too, but I have to admit that Wilkinson’s occasional jabs at Tufte were spot-on and amused me to no end.) It’s a book full of wit and great ideas, but also full of drawn-out sections that require serious focus, and it takes a while to digest it all and put it together in your mind.

So, although I’d highly recommend this book to anyone deeply interested in visualization, I’m still digesting it. What follows is not a review but just notes-to-self from my first read-through: things to follow up on and for my own reference. It might not be particularly thrilling for other readers. Continue reading “The Grammar of Graphics: notes on first reading”

Pithy and pragmatic textbooks

I enjoy the rare statistics textbook that can take its subject with a grain of salt:

The practitioner has heard that the [random field] should be ergodic, since “this is what makes statistical inference possible,” but is not sure how to check this fact and proceeds anyway, feeling vaguely guilty of having perhaps overlooked something very important.
Geostatistics: Modeling Spatial Uncertainty, by Chilès and Delfiner.

It’s a familiar feeling!
As Chilès and Delfiner wryly suggest, we statisticians could often do a better job of writing for beginners or practitioners. We should not just state the assumptions needed by our tools, but also explain how sensitive results are to the assumptions, how to check these assumptions in practice, and what else to try if they’re not met.