Courage in difficult times

Listen. I want to tell you about someone who spoke up when the stakes were high. It was 1939, the start of World War 2, in Poland. Life-or-death stakes—and I mean that literally.

I want to tell you about my great-grandmother.

Now, here in 2025 I’m hearing quite a few reports of courageous civil servants, lawyers, judges, and others standing up to the firehose of this presidential administration’s illegal orders and actions. Unfortunately, many of our representatives in the US House and Senate don’t seem to have the courage to speak up, nor to vote against the wannabe strongman in charge, despite the fact that the consequences for speaking up are still (for now) remarkably low. Absurdly low, in historical perspective. From a 2020 article in The Atlantic, but still true today:

Poles like Miłosz wound up in exile in the 1950s; dissidents in East Germany lost the right to work and study. In harsher regimes like that of Stalin’s Russia, public protest could lead to many years in a concentration camp; disobedient Wehrmacht officers were executed by slow strangulation.

By contrast, a Republican senator who dares to question whether Trump is acting in the interests of the country is in danger of—what, exactly? Losing his seat [after serving out the rest of his term] and winding up with a seven-figure lobbying job or a fellowship at the Harvard Kennedy School? […]

They are scared not of prison, the official said, but of being attacked by Trump on Twitter. They are scared he will make up a nickname for them. They are scared that they will be mocked, or embarrassed, like Mitt Romney has been. They are scared of losing their social circles, of being disinvited to parties.

In contrast to our cowards in the House and Senate today, please let me tell you about my mom’s dad’s mom: Janina Eckert. In September of 1939, on the eve of WWII, my grandfather Marian was 7 years old. As the German forces invaded Poland and started WWII, they bombed the city where my grandfather lived with his mother (his father was deeply ill with tuberculosis and convalescing at a sanatorium). Janina fled with her son (my grandfather), as well as her sister and niece, to the smaller town of Mogilno, where Janina’s brother Kazimierz had owned a pharmacy. However, great-uncle Kazimierz had already fled to the east, correctly guessing that he must be on Nazi blacklists because he had already fought to defend Poles on the Polish-German border.

Here I quote from the family history that my grandfather wrote down for us:

[The family] stood helplessly in front of the locked pharmacy. Luckily it turned out that the uncle had left spare keys with his assistant, the young pharmacist in training. He allowed the two sisters with their children into the apartment and left them with a key to the pharmacy. […]

And then suddenly the Germans appeared, greeted enthusiastically by the German ethnic minority of Mogilno. Soon they also came to the pharmacy to ask about the pharmacist [Kazimierz]. When nobody could speak to his whereabouts, they demanded that the mother and aunt must open the pharmacy and sell basic medicines. They took the young apprentice with them. Then they began arresting Mogilno’s citizens, according to the blacklist. Soon there appeared notices of execution, by the authorities, of special persons who had mounted an armed defense of the city […] On September 11th they brought to Mogilno’s town square 34 condemned people, including the apprentice pharmacist.

Out of the exhausted crowd [Janina] stood up. She spoke German well and started convincing the Germans that losing their only pharmacist would also mean a lack of pharmaceutical aid for the town’s German population. After a short exchange, they dragged the young man in the white shirt out of the queue and commanded him to return to the pharmacy.

For years after the war, this man would visit [her home], always on September 11th, with a bouquet of red-and-white roses for Janina Eckert.

Picture it, if you can. Great-grandma Janina was in an actual war zone. She was responsible for a young child (and sister and niece). Awaiting a literal public execution in the town square, with armed Nazi on all sides, she could have stayed meek and quiet and tried to protect her child by avoiding the occupiers’ attention. But instead, she stuck her neck out. She couldn’t save everyone, but she spoke up and managed to save at least one person. In fact, by saving the pharmacist, she helped the whole town—even those German residents who hated Poles like her.

Here in 2025, I’m trying to figure out what I can do to live up to great-grandma Janina’s example. The very least I can do is call and write to my representatives and attend protests. I live in Maine, where one of my representatives is Republican Senator Susan Collins, who makes a big show of claiming to be moderate but consistently votes with Trump anyway.

Senator Collins, please take note of Janina’s story. That’s how it’s done. When are you going to stand up for Mainers? For Americans? For the rule of law? Or will you merely be quietly “concerned” until it’s much too late?

Robert Santos resigns as US Census Bureau director

I am sorry to hear that Rob Santos has resigned from being director of the US Census Bureau.

Robert Santos decides to resign as US Census Bureau director midway through a 5-year term … [Santos] said in a letter Thursday evening that he made the decision “after deep reflection.” … The Texas native said in his letter that he planned to spend time with his family in retirement. [AP]

Dr Santos was also a past President of the ASA (American Statistical Association) and, from what I’ve heard, well-respected as the director at the Census Bureau.

I am wondering whether this letter is publicly available. I have not seen it on news sources or the Census Bureau website. Dr Santos’ LinkedIn post about the resignation merely says “It’s been such an honor to serve our nation.”

I had hoped Dr Santos would stay on through his full 5-year term, as long as possible, to minimize politicization (or appearance thereof) of the Census Bureau’s work.

Beyond the Census Bureau, there is plenty of other statistical turmoil at the moment:

At the direction of the Trump administration, the federal Department of Health and Human Services and its agencies are purging its websites of information and data on a broad array of topics — from adolescent health to LGBTQ+ rights to HIV. [NPR]

I would love for the current ASA leadership to rally its members, helping us to work together to support our federal statistical agencies and statistical civil servants.

Well, here we are again

It’s been a while. Years ago in 2017, I posted with concern but cautious optimism about the integrity of federal statistical data. Now in 2025, as that presidential administration returns to power, these concerns (and many others) are much sharper than ever before.

First of all, an atmosphere of “you’d better tattle on your colleagues or else you’ll get in trouble too” pervaded Communist-era 1980s Poland where I was born. That was a major reason why my parents fled to the USA with me, to raise me in a country where you could speak freely and trust your neighbors, because such snitching obviously had no place here. Now it is chilling to see that same kind of message coming directly from the top of the US executive branch:

In a new message distributed on Wednesday, government employees were warned they would face “adverse consequences” if they failed to promptly report any hidden DEI programs. […] “There will be no adverse consequences for timely reporting this information. However, failure to report this information within 10 days may result in adverse consequences,” the memo said. [Reuters]

Next, there are heavy-handed, unsubtle attempts to discourage hiring and retention of top talent across the government, likely leading to worse outcomes, leading to a feedback loop that “justifies” even more whittling down of talent and institutional knowledge in the name of “efficiency.”

Elon Musk and Vivek Ramaswamy, whom Trump appointed to lead his Department of Government Efficiency, or DOGE, suggested that requiring federal employees to return to the office five days a week “would result in a wave of voluntary terminations that we welcome.” [NPR]

Finally, focusing back on statistical data: There are also heavy-handed, unsubtle attempts to discourage participation in the decennial Census, likely leading to poorer data quality, leading to further erosion of trust in shared facts. We can’t even collect good data to begin with if we lose the public’s trust; so even if the Census changes are ultimately blocked, the fact that this has come up at all means that harm is already underway. (And if the administration’s changes do go through, they may reap further partisan advantages from changes to apportionment for the House of Representatives as well as future redistricting.)

Among the dozens of Biden-era executive orders that President Trump revoked on Monday was one that had reversed the first Trump administration’s unprecedented policy of altering a key set of census results. […] Biden’s now-revoked 2021 order affirmed the longstanding practice of including the total number of persons residing in each state in those census results. It was issued in response to Trump’s attempt during the national tally in 2020 to exclude millions of U.S. residents without legal status. [NPR]

Including a citizenship question, Passel adds, “introduces another source of potential error into the census, and it undermines public confidence in the data as well.” [NPR]

I admit the US federal statistical system wasn’t perfect by any means before this…

In recent months, budget shortfalls and the restrictions of short-term funding have led to the end of some datasets by the Bureau of Economic Analysis, known for its tracking of the gross domestic product, and to proposals by the Bureau of Labor Statistics to reduce the number of participants surveyed to produce the monthly jobs report. […] Potok says she’s currently working on an update to an American Statistical Association report released last year [in July of 2024] to sound the alarm on the risks facing the country’s data. That report concluded that the main threats to the statistical agencies include declining public participation in surveys, not enough laws to help protect the data’s integrity from political interference and neglect from congressional appropriators. [NPR]

…but at the moment, I see little reason for optimism that these threats will soon be taken seriously and addressed with integrity, given that the current president already has a history of manipulating government data and exerting political influence over scientific agencies.


PS — Nowadays Poland is doing leagues better today than when we left in the 1980s. But even there, we still have concerns about the independence of statistical agencies from political manipulation:

The International Statistical Institute (ISI) and the American Statistical Association (ASA) have raised concerns regarding the recent dismissal of Dominik Rozkrut as President of Statistics Poland (Główny Urząd Statystyczny – GUS). In a joint letter addressed to Prime Minister Donald Tusk, the organisations emphasised the vital role of professional independence in maintaining the credibility and trustworthiness of official statistics. The letter, dated 26 December 2024, highlights the importance of statistical institutions as cornerstones of evidence-based decision-making in democratic societies. The ISI and ASA warned that any threats to the independence of statistical leaders could erode public trust and undermine the integrity of official data. [ISI]

Hanukkah of Data 2022

The fall semester is over. Time to kick back and relax with… data analysis puzzles? Yes, of course!

The creators of the VisiData software have put together a “Hanukkah of Data,” 8 short puzzles released one day at a time. Four have been released already, but there’s still time for you to join in. From their announcement:

If you like the concept of Advent of Code, but wish there was set of data puzzles for data nerds, well, this year you’re in luck!

We’ve been hard at work the past couple of months creating Hanukkah of Data, a holiday puzzle hunt, with 8 days of bite-sized data puzzles. Starting December 18th, we’ll be releasing one puzzle a day, over the 8 days of Hanukkah.

This is your chance to explore a fictional dataset with SQL or VisiData or Datasette or your favorite data analysis tool, to help Aunt Sarah find the family holiday tapestry before her father notices it’s missing!

Register here to receive notifications when puzzles become available.

I can’t remember where I heard about this, but I’m very glad I did. I wasn’t familiar with VisiData before this, but I look forward to giving it a try too. For now, I’m just using R and enjoying myself tremendously. The puzzles are just the right length for my end-of-semester brain, the story is sweet, and the ASCII artwork is gorgeous. Many thanks to Saul Pwanson and colleagues for putting this together.

Partially lit ASCII art menorah from the Hanukkah of Data puzzle website

Are there other efforts like this in the Statistics and/or R communities? Hanukkah of Data is the kind of thing I would love to assign my students to help them practice their data science skills in R. Here are closest other things I’ve seen, though none are quite the same:

Hiring a tenure-track statistician at Colby College

We’re hiring for a tenure-track faculty member in Statistics! Are you interested in teaching at a beautiful small liberal arts college in Maine? Are you looking for academic positions that value a balance of teaching & research — and provide resources to support you in both regards? Not to mention a competitive salary, good benefits, and all four seasons in a small New England town? Please do apply, and reach out to me with any questions, or share the ad with anyone you know who might be a good fit:

https://www.colby.edu/statistics/faculty-searches/

https://www.mathjobs.org/jobs/list/21000

We will start reviewing applications on October 24 and continue until the position is filled.

(And if you’re not just a solo statistician, but you are working on a two-body problem with a computationally-focused partner, then let me also note that both our Davis AI Institute and our CS department are hiring too this year.)

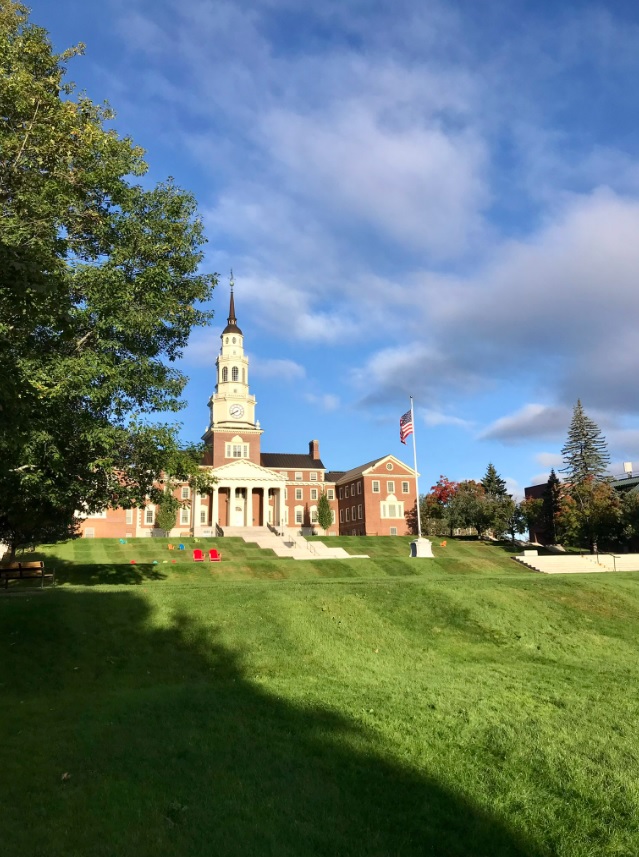
Brick building of Miller Library and long lawn on the Colby College campus

Some new developments since last time we had a faculty search in Statistics:

  • We have our own Department of Statistics — still quite rare among liberal arts colleges
  • We are working with Colby’s Davis Institute of Artificial Intelligence — the first such AI Institute at a liberal arts college;
  • In addition to our Data Science minor, we are close to approving a Data Science major in collaboration with Colby’s departments of Mathematics and of Computer Science

In terms of research, there are generous startup funds (more than I’ve been able to use so far) and plenty of other support for research materials, conference travel, etc.

The teaching load is 9 courses every 2 years. That comes out to 2 courses most semesters, and 3 every fourth semester. While we provide regular offerings of Intro Stats, Statistical Modeling, and other core courses, in a typical year each of us also gets to teach a favorite elective or two. For example, I have gotten to work on some great partnerships by planning Survey Sampling or Data Visualization courses with our Civic Engagement office. My students have shown care, respect, and insight as they help our local homeless shelter study what resources improve housing outcomes; or help our town fire department to survey citizens and local businesses to inform its five-year plan.

And frankly, it’s just plain fun to work across disciplines. I’ve help a Government major figure out how to collect & analyze a random sample of news articles for a project on public transport in Central America. I’ve helped a Biology professor figure out how to bootstrap an imbalanced experiment on amoebas, and I’ve learned nifty nuggets of data visualization history from an English professor.

Long story short: I really do enjoy teaching statistics in the liberal arts college environment. If you think you would too, come join us!

surveyCV: K-fold cross validation for complex sample survey designs

I’m fortunate to be able to report the publication of a paper and associated R package co-authored with two of my undergraduate students (now alums), Cole Guerin and Thomas McMahon: “K-Fold Cross-Validation for Complex Sample Surveys” (2022), Stat, doi:10.1002/sta4.454 and the surveyCV R package (CRAN, GitHub).

The paper’s abstract:

Although K-fold cross-validation (CV) is widely used for model evaluation and selection, there has been limited understanding of how to perform CV for non-iid data, including from sampling designs with unequal selection probabilities. We introduce CV methodology that is appropriate for design-based inference from complex survey sampling designs. For such data, we claim that we will tend to make better inferences when we choose the folds and compute the test errors in ways that account for the survey design features such as stratification and clustering. Our mathematical arguments are supported with simulations and our methods are illustrated on real survey data.

Long story short, traditional K-fold CV assumes that your rows of data are exchangeable, such as iid draws or simple random samples (SRS). But in survey sampling, we often use non-exchangeable sampling designs such as stratified sampling and/or cluster sampling.1

Illustration of simple random sampling, stratified sampling, and cluster sampling

Our paper explains why in such situations it can be important to carry out CV that mimics the sampling design.2 First, if you create CV folds that follow the same sampling process, then you’ll be more honest with yourself about how much precision there is in the data. Next, if on these folds you train fitted models and calculate test errors in ways that account for the sampling design (including sampling weights3), then you’ll generalize from the sample to the population more appropriately.

If you’d like to try this yourself, please consider using our R package surveyCV. For linear or logistic regression models, our function cv.svy() will carry out the whole K-fold Survey CV process:

  • generate folds that respect the sampling design,
  • train models that account for the sampling design, and
  • calculate test error estimates and their SE estimates that also account for the sampling design.

For more general models, our function folds.svy() will partition your dataset into K folds that respect any stratification and clustering in the sampling design. Then you can use these folds in your own custom CV loop. In our package README and the intro vignette, we illustrate how to use such folds to choose a tuning parameter for a design-consistent random forest from the rpms R package.

Finally, if you are already working with the survey R package and have created a svydesign object or a svyglm object, we have convenient wrapper functions folds.svydesign(), cv.svydesign(), and cv.svyglm() which can extract the relevant sampling design info out of these objects for you.

It was very rewarding to work with Cole and Thomas on this project. They did a lot of the heavy lifting on setting up the initial package, developing the functions, and carrying out simulations to check whether our proposed methods work the way we expect. My hat is off to them for making the paper and R package possible.

Some next steps in this work:

  • Find additional example datasets and give more detailed guidance around when there’s likely to be a substantial difference between usual CV and Survey CV.
  • Build in support for automated CV on other GLMs from the survey package beyond the linear and logistic models. Also, write more examples of how to use our R package with existing ML modeling packages that work with survey data, like those mentioned in Section 5 of Dagdoug, Goga, and Haziza (2021).
  • Try to integrate our R package better with existing general-purpose R packages for survey data like srvyr and for modeling like tidymodels, as suggested in this GitHub issue thread.
  • Work on better standard error estimates for the mean CV loss with Survey CV. For now we are taking the loss for each test case (e.g., the squared difference between prediction and true test-set value, in the case of linear regression) and using the survey package to get design-consistent estimates of the mean and SE of this across all the test cases together. This is a reasonable survey analogue to the standard practice for regular CV—but alas, that standard practice isn’t very good. Bengio and Grandvalet (2004) showed how hard it is to estimate SE well even for iid CV. Bates, Hastie, and Tibshirani (2021) have recently proposed another way to approach it for iid CV, but this has not been done for Survey CV yet.

Ukraine and Poland

We have been gravely following the heartbreaking news from Ukraine.
Flag of Ukraine
I have written before about one set of my grandparents, and how they met as schoolteachers in the aftermath of WWII. Now, as I read news about evacuation trains from Ukraine to Poland, my mind keeps coming back to the reason why my grandmother’s parents settled in western Poland in the first place: Soon after the war, her father got advance warning that his family was about to be forcibly resettled to somewhere deep in the interior of Russia. Instead, they packed in a hurry and decided to travel west, west, west, as far from the USSR as possible. From formerly-northeastern-Poland they rode the slow, crowded train for several weeks. According to family lore, they stopped only when the train tracks literally ran out and they could go no further. In light of the past few weeks, it seems to have been a wise decision. She still lives in western Poland and is safe at the moment—but after seeing decades of what seemed like slow, grueling social and political change for the better, she never expected to be so near a war zone again in her 90s.

As for my grandfather, he became a history student at university but got in trouble with the Soviet police for his “critical stance towards reality” (i.e., asking questions and not toeing the party line). He was forced out without the degree he had earned and sent to a tiny rural town to teach Phys Ed., instead of history. Although it’s fortunate for me that he met my grandmother there, it took him years of waiting for a political thaw before he was allowed to finish his degree and teach his students the historical facts and contexts that he knew they needed to learn. As an educator who spent the rest of his life working to broaden the minds of his students and fellow citizens, he would be dismayed by the echo chambers that still exist in Russian state media today.

So what can we do, here and now? Out of all the many worthy causes that need urgent support, I’d like to highlight one: Helping Ukrainian people with intellectual disabilities and their families.


Living in a war zone is horrific for everyone. A group that needs particular help is folks (like one of my own children) with intellectual and mobility challenges, who can’t just get up and leave on their own even if the roads are open. Inclusion Europe and Ukraine VGO Coalition are collecting funds for direct assistance for Ukrainian families in this situation. Please keep these groups or similar causes in mind, if you are fortunate enough to be able to make charitable donations.

The other thing we can do is encourage our leaders to remain in solidarity with Ukraine, even when we start to feel the economic effects ourselves around the world. This debate is very active in Poland right now, where individuals and charities are rushing in to help Ukrainian refugees but worrying about how long they can sustain the effort. Here is (my own rushed translation of) an excerpt from an opinion piece by Katarzyna Pełczyńska-Nałęcz, former Polish ambassador to Moscow:

Can we afford gasoline at 10 zł/liter (~$9/gal)? Before we ask, let’s think about the stakes in this war. […] The first shock has passed. We are getting used to the reality of being a country on the war front. The price of gas is spiking. Food prices will rise soon too[…] We will have to share hospitals and schools with over a million refugees. We are starting to see exhaustion and anger. [Among other things,] anger at our government, which brags about how Poland has welcomed the refugees, even though actually the massive volunteer efforts of the populace are doing most of this work in the government’s place. […] And then we start to wonder if maybe this is all overblown, if there are limits to self-sacrifice, if maybe it’s not worth taking on such great costs, because we too have our own worries and debts and lives.

Yet at this moment, it’s important to remind ourselves what the stakes are.

[Because if Ukraine loses, then] another Iron Curtain will fall on our eastern border. Beyond it, the Russians will build a totalitarian state, which will root out everything that is Ukrainian and terrorize our neighbors into one “great” Russian nation. […] From Ukraine there will be not 2 million but 10-15 million refugees. And along our borders, from the Baltic Sea to the Bieszczady Mountains, the Russian military will be standing there armed to the teeth. Putin, threating us with his nuclear button, will demand that the Americans leave Poland. Many businesses, but also everyday people, will start to wonder whether Poland is indeed a country worth investing in and living in. […]

So when the difficult moments come – and in the coming days there will come more and more of them – when we are overwhelmed with frustration and doubt, when we think that maybe our government is right and we can’t afford 10 zł/liter gasoline, then let’s simply remember what the stakes are in this war.


Update: For any academic readers, I’m also passing along a note from David Swanson, Professor Emeritus of Sociology, University of California Riverside:

For those interested in assisting our Ukrainian colleagues, a website set up and maintained by faculty at Charles University in the Czech Republic is a site where one can post offers of aid (e.g., a visiting scholar position) and where colleagues in Ukraine can access information about job offers, fellowships etc. directly at one place in the internet: https://helpline-demography.eu/

Please feel free to send any information to info@helpline-demography.eu

In memoriam: Leland Wilkinson

I am saddened to hear that Lee Wilkinson passed away a few days ago. Wilkinson created the hugely influential concept of a “Grammar of Graphics” and wrote it up in a thorough, thought-provoking book. Through his writings and his own entrepreneurial spirit (he started SYSTAT and sold it to SPSS, then worked with Tableau and H20.ai among others), the Grammar of Graphics became a hugely influential idea4, adopted in many powerful data visualization software packages—Tableau, R’s ggplot2, Python’s plotnine, Javascript’s D3.js and Vega, the SPSS Graphics Production Language (GPL) and Visualization Designer, IBM VizJSON…

Leland Wilkinson

Wilkinson was supposed to speak at a Data Visualization New York meetup tomorrow; instead, it has become a memorial tribute session. The event is online and open to all. Meanwhile, I have seen heartfelt tributes to Wilkinson from a who’s who of the data visualization world: Hadley Wickham (developer of ggplot2), Nathan Yau (creator of FlowingData), Jessica Hullman (prolific dataviz researcher), Jon Schwabish (creator of PolicyViz), Jeff Heer (developer of D3.js and Vega)… Everyone reiterates that he was not only an influential scholar, but also a generous, kind, decent human being.

Apart from his visualization work, I loved Wilkinson’s voice in a report written mostly by him on behalf of the American Psychological Association’s 1999 Task Force on Statistical Inference. Here’s the note I wrote myself when I first ran across this report, and I still stand by it:

This is a really great, short, but fairly complete overview of major components in a statistical study...
i.e., the things you want your junior statistician colleague to know without being told...
i.e., the things we ought to teach AND MEASURE ON our stats students.

Two of my favorite quotes from that report:

“Statistical power does not corrupt.”

and

The main point of this example is that the type of “atheoretical” search for patterns that we are sometimes warned against in graduate school can save us from the humiliation of having to retract conclusions we might ultimately make on the basis of contaminated data. We are warned against fishing expeditions for understandable reasons, but blind application of models without screening our data is a far graver error.

I had the incredible good fortune of meeting Wilkinson myself at a conference, though regrettably just once. This was SDSS 2019 in Seattle—the last conference I attended in person before the pandemic. One groggy morning, I stepped away from my conference breakfast table to get a second cup of coffee. I came back to find that Wilkinson had just sat down, thinking the table was empty. We ended up having a genuinely delightful conversation. I asked how he had managed to combine so many fascinating strands of work in his career, and he told me it had been a roundabout path: if I remember correctly, he had dropped his math major in his first week of college and switched to English; then later dropped out of divinity school; then just barely finished Psychology graduate school because he couldn’t stop tinkering with computers instead; then became a statistical software entrepreneur… He also reminisced fondly about attending conferences as a young researcher, where he got to hear giants in the field get drunk at the open bar and tell their life story 😛 Wilkinson was a witty and warm conversation partner. After breakfast he invited me to keep in touch, and I deeply regret that I never followed up. Rest in peace, Leland Wilkinson.

Big Data Paradox and COVID-19 surveys

Welcome, new readers. I’m seeing an uptick in visits to my post on Xiao-Li Meng’s “Big Data Paradox,” probably due to the Nature paper that was just published: “Unrepresentative big surveys significantly overestimated US vaccine uptake” (Bradley et al., 2021).

Meng is one of the coauthors of this new Nature paper, which discusses the Big Data Paradox in context of concerns about two very large but statistically-biased US surveys related to the COVID-19 pandemic: the Delphi-Facebook survey and the Census Household Pulse survey. As someone who has worked with both the Delphi group at CMU and with the Census Bureau, I can’t help feeling a little defensive 🙂 but I do agree that both surveys show considerable statistical bias (at least nonresponse bias for the Census survey; and biases in the frame and sampling as well as nonresponse for the Delphi survey). More work is needed on how best to carry out & analyze such surveys. I don’t think I can put it any better myself than Frauke Kreuter’s brief “What surveys really say”, which describes the context for all of this and points to some of the research challenges needed in order to move ahead.

I hope my 2018 post is still a useful glimpse at the Big Data Paradox idea. That said, I also encourage you to read the Delphi team’s response to (an earlier draft of) Bradley et al.’s Nature paper. In their response, Reinhart and Tibshirani agree that the Delphi-Facebook survey does show sampling bias and that massive sample sizes don’t always drive mean squared errors to zero. But they also argue that Delphi’s survey is still appropriate for its intended uses: quickly detecting possible trends of rapid increase (say, in infections) over time, or finding possible hotspots across nearby geographies. If the bias is relatively stable over short spans of time or space, these estimated differences are still reliable. They also point out how Meng’s data defect correlation is not easily interpreted in the face of survey errors other than sampling bias (such as measurement error). Both Kreuter’s and Reinhart & Tibshirani’s overviews are well worth reading.

Your sabbatical has been eaten by a grue

Nerd alert! Do you remember those old-school text adventure games, aka interactive fiction?

> GO EAST
You enter Jerzy's office. You see an accordion and some junk mail here.
> TAKE ACCORDION
Taken.
> PLAY ACCORDION
You don't know any tunes on the accordion.

…and so on? Well, I recently discovered the excellent “50 Years of Text Games” blog. It’s been fun to revisit some old memories and learn about some lost gems. Maybe you’ll enjoy it too.5

Logo for the 50 Years of Text Games blog
Continue reading “Your sabbatical has been eaten by a grue”