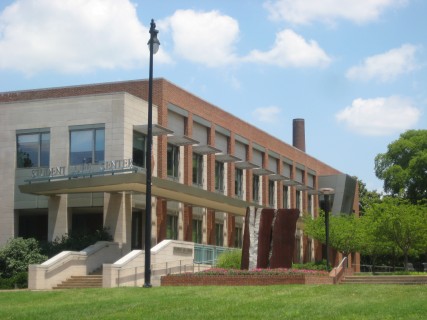
First of all, useR 2012 (the 8th International R User Conference) was, hands down, the best-organized conference I’ve had the luck to attend. The session chairs kept everything moving on time, tactfully but sternly; the catering was delicious and varied; and Vanderbilt University’s leafy green campus and comfortable facilities were an excellent setting. Many thanks to Frank Harrell and the rest of Vanderbilt’s biostatistics department for hosting!

Arriving in Nashville on Monday night, I didn’t make it to Bill Venables’ short course, but I heard it was quite useful and his course materials are available online.
On Tuesday I attended two half-day tutorials: one on Building R Web Applications with Rook, by Jeff Horner, and another on Geospatial Data in R and Beyond, by Barry Rowlingson.
- Jeff’s course introduced how to use his
Rookpackage to set up a web server that communicates with R. He has also authored several other useful R tools, includingbrewandrApache. Once I get a chance to go back through Jeff’s course materials and digest it all, I hope to showcase a few working examples here. - Barry gave a broad overview of the history of geospatial data in R, the current status, and several other useful open-source tools. Check out his course materials for the presentations, some worked examples on the Workshops tab, and a really handy cheatsheet for R’s most important spatial functions. He also recommended downloading and burning yourself a copy of the OSGeo-Live DVD for trying out various open-source geospatial tools.
(Barry also mentioned that the Maunga Whau dataset from R’sexample(volcano)is not as big and scary as it looks, but rather a city park I’ve visited in Auckland, NZ.)

I wish I could have seen many of the other tutorials. So far I’ve also found the materials from Dirk Eddelbuettel’s Introduction to Rcpp, and Bob Muenchen’s Managing Data with R.
During the Rook course I sat near Daniel Kaplan, who uses R to teach not only statistical modeling but introductory calculus as well. I then had the pleasure of eating lunch with Daniel, Jeff, and also Hadley Wickham, creator of ggplot2 and other stellar packages. (Hadley taught a visualization tutorial that afternoon; I haven’t found those slides yet, but his website hosts materials from his past courses.)
Discussion turned to the brand-new programming language (and R competitor?), Julia. Hadley pointed out that most time and effort in statistics is “cognitive, not computational”; he uses R because it’s practical to work with, even if it’s a bit slower and lacks Julia’s computer-science purity. As Jeff and Hadley said, R natively supports things like dataframes, formulas, and NAs that are fundamental to data analysis.
On Tuesday night’s mixer and over dinner and drinks, I enjoyed catching up with folks including Harlan Harris of the Data Science DC Meetup and the crew from Revolution Analytics. I hadn’t realized that Revolution also ran free webinars, many of which seem worth a look.
Wednesday was the first day of the conference proper. To be continued…
See also the slides and code from my own talk, and my braindump on the rest of the conference.

One thought on “useR 2012: impressions, tutorials”
Comments are closed.