U.S. Census Bureau releases API

The Census API, which was in the works for a while, was finally made publicly available yesterday (news release).

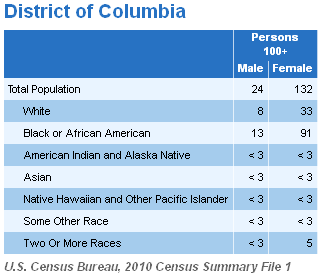
I’ve heard the DC dating scene is tough for single women… But especially for centenarians!

So far, two datasets are accessible:

  • the 2010 Census Summary File 1, providing counts down to the tract and block levels
  • the 2006-2010 American Community Survey five-year estimates, providing estimates down to the tract and block-group levels (but not all the way down to blocks)

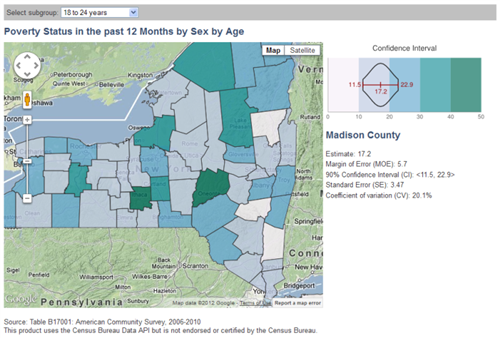
The developers page provides more information and showcases a couple of the first few apps using the API so far, including one by Cornell’s Jan Vink (whose online poverty maps I’ve mentioned before).

For a handy list of the other government agencies with APIs and developers pages, check out the FCC’s developers page.

Maps of changes in area boundaries, with R

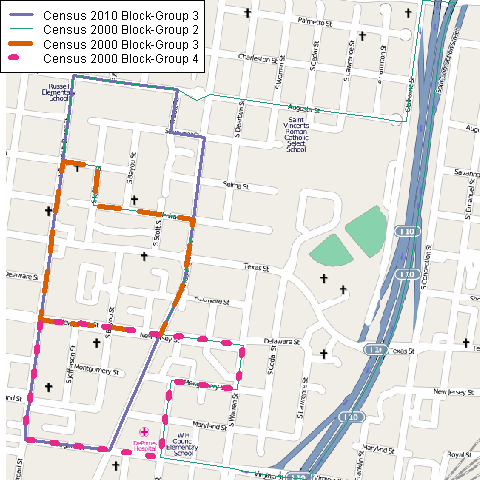
Today a coworker needed some maps showing boundary changes. I used what I learned last week in the useR 2012 geospatial data course to make a few simple maps in R, overlaid on OpenStreetMap tiles. I’m posting my maps and my R code in case others find them useful.

A change in Census block-groups from 2000 to 2010, in Mobile, AL

Continue reading “Maps of changes in area boundaries, with R”

API, and online mapping platforms

The Census Bureau is beta-testing a new API for developers. As I understand it, within hours of the API going live, Jan Vink incorporated it into an updated version of the interactive maps I’ve discussed before.

I think the placement of the legend on the side makes it easier to read than the previous version, where it was below. It’s a great development for the map — and a good showcase for the Census Bureau’s API, which I hope will become ready for public use in the near future.

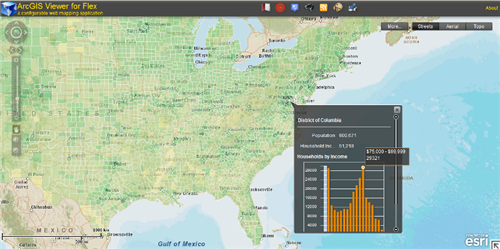
I’d love to see this and related approaches become available in several environments or frameworks for online/interactive mapping tools. One possibility is to make widgets for the ArcGIS Viewer for Flex platform, which works with ESRI’s ArcGIS products.

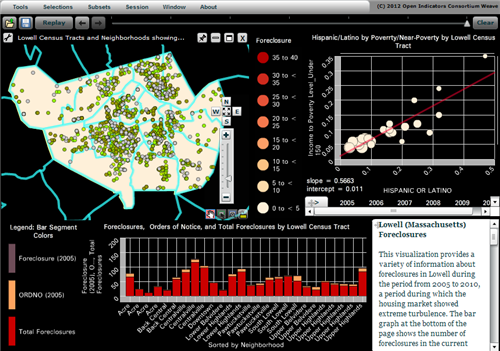
Another great environment I’m just learning about is Weave. This week the Census Bureau is hosting Dr. Georges Grinstein, of the University of Massachusetts at Lowell, who is building a powerful open-source platform for integrating and visualizing data. This is being developed alongside a consortium of local governments and nonprofits who are using Weave for information dashboards, data dissemination, etc.
It seems to be a mix of Actionscript, Javascript, and C++, so extending Weave’s core functionality sounds a bit daunting, but I was very glad to see that advanced users can call R scripts inside of a visualization. This will let you analyze and plot data in ways that the Weave team did not explicitly foresee.

In short, there’s plenty of exciting work being done in this arena!

In defense of the American Community Survey

Disclaimer: All opinions expressed on this blog are my own and are not intended to represent those of the U.S. Census Bureau.
Edit: Please also read the May 11th official statement responding to the proposed cuts, by Census Bureau Director Robert Groves.
(Again, although of course my opinions are informed by my work with the Bureau, my post below is strictly as a private citizen. I have neither the authority nor the intent to be an official spokesperson for the Census Bureau.)

Yesterday the U.S. House of Representatives voted to eliminate the American Community Survey (ACS). The Senate has not passed such a measure yet. I do not want to get political, but in light of these events it seems appropriate to highlight some of the massive benefits that the ACS provides.

For many variables and indicators, the ACS is the only source of nationally-comparable local data. That is, if you want a detailed look at trends and changes over time, across space, or by demographic group, the ACS is your best dataset for many topics. Take a look at the list of data topics on the right-hand side of the ACS homepage: aging, disability, commuting to work, employment, language, poverty…

Businesses use the ACS to analyze markets: Can people afford our product here?  Should we add support for speakers of other languages? Does the aging population here need the same services as the younger population there? Similarly, public health officials use ACS information about population density when deciding where to place a new hospital. Dropping the ACS would increase risks with no corresponding direct benefits to businesses or local governments.

Local authorities can and do commission their own local studies of education levels or commute times; but separate surveys by each area might use incompatible questions. Only the ACS lets them compare such data to their neighbors, to similar localities around the country, and to their own past.

The Census Bureau works long and hard to ensure that each survey is well-designed to collect only the most important data with minimal intrusion. For example, even the flush toilet question (cited deprecatingly by the recent measure’s author) is useful data about infrastructure and sanitation. From the ACS page on “Questions on the form and why we ask”:

Complete plumbing facilities are defined as hot and cold running water, a flush toilet, and a bathtub or shower. These data are essential components used by the U.S. Department of Housing and Urban Development in the development of Fair Market Rents for all areas of the country. Federal agencies use this item to identify areas eligible for public assistance programs and rehabilitation loans. Public health officials use this item to locate areas in danger of ground water contamination and waterborne diseases.

Besides the direct estimates from the ACS itself, the Census Bureau uses ACS data as the backbone of several other programs. For example, the Small Area Income and Poverty Estimates program provides annual data to the Department of Education for use in allocating funds to school districts, based on local counts and rates of children in poverty. Without the ACS we would be limited to using smaller surveys (and thus less accurate information about poverty in each school district) or older data (which can become outdated within a few years, such as during the recent recession). Either way, it would hurt our ability to allocate resources fairly to schoolchildren nationwide.

Similarly, the Census Bureau uses the ACS to produce other timely small-area estimates required by Congressional legislation or requested by other agencies: the number of people with health insurance, people with disabilities, minority language speakers, etc. The legislation requires a data source like the ACS not only so that it can be carried out well, but also so its progress can be monitored.

Whatever our representatives may think about the costs of this survey, I hope they reflect seriously on all its benefits before deciding whether to eliminate the ACS.
Director Groves leaving Census Bureau

I’m sorry to hear that our Census Bureau Director, Robert Groves, is leaving the Bureau for a position as provost of Georgetown University. The Washington Post, Deputy Commerce Secretary Rebecca Blank, and Groves himself reflect on his time here.

I have only heard good things about Groves from my colleagues. Besides the achievements listed in the links above, my senior coworkers tell me that the high number and quality of visiting scholars / research seminars here, in recent years, is largely thanks to his encouragement. He has also set a course for improving the accessibility and visualization of the Bureau’s data; I strongly hope future administrations will continue supporting these efforts.

Finally, here is a cute story I heard (in class with UMich’s Professor Steven Heeringa) about Groves as a young grad student. I’m sure the Georgetown students will enjoy having him there:

“In the days in ’65 when Kish’s book was published, there were no computers to do these calculations. So variance estimation for complex sample designs was all done through manual calculations, typically involving calculating machines, rotary calculators.

I actually arrived in ’75 as a graduate student in the sampling section, and they were still using rotary calculators. I brought the first electronic calculator to the sampling section at ISR, and people thought it was a little bit of a strange device, but within three months I had everybody convinced.

Otherwise we had these large rotary calculators that would hum and make noise, and Bob Groves and I — there was a little trick with one of the rotary calculators: if you pressed the correct sequence of buttons, it would sort of iterate and it would start humming like a machine gun, and so if you can imagine Bob Groves fiddling around on a rotor calculator to sorta create machine gun type noises in the sampling section at ISR… I’m sure he’d just as soon forget that now, but we were all young once, I guess.”

Dr Groves, I hope you continue to make the workplace exciting 🙂 and wish you all the best in your new position!