Carl Morris Symposium on Large-Scale Data Inference (2/3)

Continuing the summary of last week’s symposium on statistics and data visualization (see part 1 and part 3)… Here I describe Dianne Cook’s discussion of visual inference, and Rob Kass’ talk on statistics in cognitive neuroscience.

[Edit: I’ve added a few more related links throughout the post.]

Continue reading “Carl Morris Symposium on Large-Scale Data Inference (2/3)”

Commandeering a map from PDF or EPS, using Inkscape and R

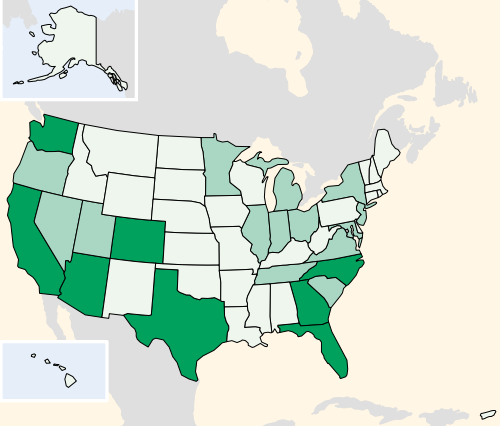
I love Nathan Yau’s tutorial on making choropleths from a SVG file. However, if you don’t have a SVG handy already and instead you want to repurpose a map from another vector format such as PDF or EPS, there are a few extra steps that can be done in the free tool Inkscape. And while I’m at it, how could I turn down the opportunity to replicate Nathan’s Python approach in R instead?

The following was inspired by the 300-page Census Atlas of the United States, full of beautiful maps of 2000 decennial census data. I particularly liked the small multiples of state maps, which were highly generalized (i.e. the fine detail was smoothed out) but still recognizable, and DC was enlarged to be big enough to see.

I have wanted a map like this for my own purposes, when mapping a variable for all 50 states and DC. Unfortunately, I haven’t been able to track down any colleagues who know where to find the original shapefiles for this map. Fortunately, several images from the Census Atlas are available in EPS format near the bottom of this page, under “PostScript Map Files.” With access to such vector graphics, we can get started.

Continue reading “Commandeering a map from PDF or EPS, using Inkscape and R”

Making R graphics legible in presentation slides

I only visited a few JSM sessions today, as I’ve been focused on preparing for my own talk tomorrow morning. However, I went to several talks in a row which all had a common problem that made me cringe: graphics where the fonts (titles, axes, labels) are too small to read.

You used R's default settings when putting this graph in your slides? Too bad I won't be able to read it from anywhere but the front of the room.

Dear colleagues: if we’re going to the effort of analyzing our data carefully, and creating a lovely graph in R or otherwise to convey our results in a slideshow, let’s PLEASE save our graphs in a way that the text is legible on the slides! If the audience has to strain to read your graphics, it’s no easier to digest than a slide with dense equations or massive tables of numbers.

For those of us working in R, here are some very quick suggestions that would help me focus on the content of your graphics, not on how hard I’m squinting to read them.

Continue reading “Making R graphics legible in presentation slides”

useR 2012: main conference braindump

I knew R was versatile, but DANG, people do a lot with it:

> > … I don’t think anyone actually believes that R is designed to make *everyone* happy. For me, R does about 99% of the things I need to do, but sadly, when I need to order a pizza, I still have to pick up the telephone. —Roger Peng

> There are several chains of pizzerias in the U.S. that provide for Internet-based ordering (e.g. www.papajohnsonline.com) so, with the Internet modules in R, it’s only a matter of time before you will have a pizza-ordering function available. —Doug Bates

Indeed, the GraphApp toolkit … provides one (for use in Sydney, Australia, we presume as that is where the GraphApp author hails from). —Brian Ripley

So, heads up: the following post is super long, given how much R was covered at the conference. Much of this is a “notes-to-self” braindump of topics I’d like to follow up with further. I’m writing up the invited talks, the presentation and poster sessions, and a few other notes. The conference program has links to all the abstracts, and the main website should collect most of the slides eventually.

Continue reading “useR 2012: main conference braindump”

Maps of changes in area boundaries, with R

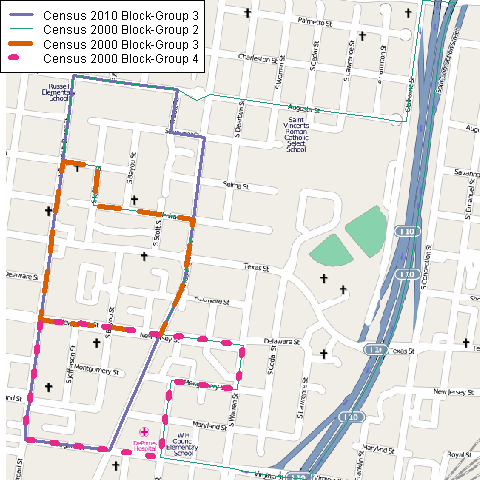
Today a coworker needed some maps showing boundary changes. I used what I learned last week in the useR 2012 geospatial data course to make a few simple maps in R, overlaid on OpenStreetMap tiles. I’m posting my maps and my R code in case others find them useful.

A change in Census block-groups from 2000 to 2010, in Mobile, AL

Continue reading “Maps of changes in area boundaries, with R”

useR 2012: impressions, tutorials

First of all, useR 2012 (the 8th International R User Conference) was, hands down, the best-organized conference I’ve had the luck to attend. The session chairs kept everything moving on time, tactfully but sternly; the catering was delicious and varied; and Vanderbilt University’s leafy green campus and comfortable facilities were an excellent setting. Many thanks to Frank Harrell and the rest of Vanderbilt’s biostatistics department for hosting!

Plus there's a giant statue of bacon. What's not to love?

Continue reading “useR 2012: impressions, tutorials”

Getting SASsy

Although I am most familiar with R for statistical analysis and programming, I also use a fair amount of SAS at work.

I found it a huge transition at first, but one thing that helped make SAS “click” for me is that it was designed around those (now-ancient) computers that used punch cards. So the DATA step processes one observation at a time, as if you were feeding it punch cards one after another, and never loads the whole dataset into memory at once. I think this is also why many SAS procedures require you to sort your dataset first. It makes some things awkward to do, and often it takes more code than the equivalent in R, but on the other hand it means you can process huge datasets without worrying about whether they will fit into memory. (Well… memory size should be a non-issue for the DATA step, but not for all procedures. We’ve run into serious memory issues on large datasets when using PROC MIXED and PROC MCMC, so using SAS does not guarantee that you never have to fear large data.)

The Little SAS Book (by Delwiche and Slaughter) and Learning SAS by Example (by Cody) are two good resources for learning SAS. If you’re able to take a class directly from the SAS Institute, they tend to be taught well, and you get a book of class notes with a very handy cheat sheet.

Matrix vs Data Frame in R

Today I ran into a double question that might be relevant to other R users:
Why can’t I assign a dataframe row into a matrix row?
And why won’t my function accept this dataframe row as an input argument?

A single row of a dataframe is a one-row dataframe, i.e. a list, not a vector. R won’t automatically treat dataframe rows as vectors, because a dataframe’s columns can be of different types. So converting them to a vector (which must be all of a single type) would be tricky to generalize.

But if in your case you know all your columns are numeric (no characters, factors, etc), you can convert it to a numeric matrix yourself, using the as.matrix() function, and then treat its rows as vectors.

> # Create a simple dataframe
> # and an empty matrix of the same size
> my.df <- data.frame(x=1:2, y=3:4)
> my.df
  x y
1 1 3
2 2 4
> dim(my.df)
[1] 2 2
> my.matrix <- matrix(0, nrow=2, ncol=2)
> my.matrix
     [,1] [,2]
[1,]    0    0
[2,]    0    0
> dim(my.matrix)
[1] 2 2
>
> # Try assigning a row of my.df into a row of my.matrix
> my.matrix[1,] <- my.df[1,]
> my.matrix
[[1]]
[1] 1

[[2]]
[1] 0

[[3]]
[1] 3

[[4]]
[1] 0

> dim(my.matrix)
NULL
> # my.matrix became a list!
>
> # Convert my.df to a matrix first
> # before assigning its rows into my.matrix
> my.matrix <- matrix(0, nrow=2, ncol=2)
> my.matrix[1,] <- as.matrix(my.df)[1,]
> my.matrix
     [,1] [,2]
[1,]    1    3
[2,]    0    0
> dim(my.matrix)
[1] 2 2
> # Now it works.
>
> # Try using a row of my.df as input argument
> # into a function that requires a vector,
> # for example stem-and-leaf-plot:
> stem(my.df[1,])
Error in stem(my.df[1, ]) : 'x' must be numeric
> # Fails because my.df[1,] is a list, not a vector.
> # Convert to matrix before taking the row:
> stem(as.matrix(my.df)[1,])

  The decimal point is at the |

  1 | 0
  1 |
  2 |
  2 |
  3 | 0

> # Now it works.

For clarifying dataframes vs matrices vs arrays, I found this link quite useful:
http://faculty.nps.edu/sebuttre/home/R/matrices.html#DataFrames

Stats 101 resources

A few friends have asked for self-study resources on learning (or brushing up on) basic statistics. I plan to keep updating this post as I find more good suggestions.

Of course the ideal case is to have a good teacher in a nice classroom environment:

The best classroom setting

For self-study, however, you might try an open course online. MIT has some OpenCourseWare for mathematics (including course 18.433, “Statistics for Applications”), and Carnegie Mellon offers free online courses in statistics. I have not tried them myself yet but hear good things so far.

As for textbooks: Freedman, Pisani, and Purves’ Statistics is a classic intro to the key concepts and seems a great way to get up to speed.
Two other good “gentle” conceptual intros are The Cartoon Guide to
Statistics
and How to Lie with Statistics. Also useful is Statistics Done Wrong [see my review], an overview of common mistakes in designing studies or applying statistics.
But I believe they all try to avoid equations, so you might need another source to show you how to actually crunch the numbers.
My undergrad statistics class used Devore and Farnum’s Applied Statistics for Engineers and Scientists. I haven’t touched it in years, so I ought to browse it again, but I remember it demonstrated the steps of each analysis quite clearly.
If you end up using the Devore and Farnum book, Jonathan Godfrey has converted the 2nd edtion’s examples into R.
[Edit: John Cook’s blog and his commenters have some good advice about textbooks. They also cite a great article by George Cobb about how to choose a stats textbook.]

Speaking of R, I would suggest it if you don’t already have a particular statistical software package in mind. It is open source and a free download, and I find that working in R is similar to the way I think about math while working it out on paper (unlike SPSS or SAS or Stata, all of which are expensive and require a very different mindset).
I list plenty of R resources in my R101 post. In particular, John Verzani’s simpleR seems to be a good introduction to using R, and reviews on a lot of basic statistics along the way (though not in detail).
People have also recommended some books on intro stats with R, especially Dalgaard’s Introductory Statistics with R or Maindonald & Braun’s Data Analysis and Graphics Using R.

For a very different approach to introductory stats, my former professor Allen Downey wrote a book called Think Stats aimed at programmers and using Python. I’ve only just read it, and I have a few minor quibbles that I want to discuss with him, but it’s a great alternative to the classic approach. As Allen points out, “standard statistical techniques are really computational shortcuts, which is less important when computation is cheap.” Both mindsets are good to have under your belt, but Allen’s is one of the few intro books so far for the computational route. It’s published by O’Reilly but Allen also makes a free version available online, as well as a related blog full of good resources.
Speaking of O’Reilly, apparently their book Statistics Hacks contains major conceptual errors, so I would have to advise against it unless they fix them in a future edition.