In memoriam: Leland Wilkinson

I am saddened to hear that Lee Wilkinson passed away a few days ago. Wilkinson created the hugely influential concept of a “Grammar of Graphics” and wrote it up in a thorough, thought-provoking book. Through his writings and his own entrepreneurial spirit (he started SYSTAT and sold it to SPSS, then worked with Tableau and H20.ai among others), the Grammar of Graphics became a hugely influential idea1, adopted in many powerful data visualization software packages—Tableau, R’s ggplot2, Python’s plotnine, Javascript’s D3.js and Vega, the SPSS Graphics Production Language (GPL) and Visualization Designer, IBM VizJSON…

Leland Wilkinson

Wilkinson was supposed to speak at a Data Visualization New York meetup tomorrow; instead, it has become a memorial tribute session. The event is online and open to all. Meanwhile, I have seen heartfelt tributes to Wilkinson from a who’s who of the data visualization world: Hadley Wickham (developer of ggplot2), Nathan Yau (creator of FlowingData), Jessica Hullman (prolific dataviz researcher), Jon Schwabish (creator of PolicyViz), Jeff Heer (developer of D3.js and Vega)… Everyone reiterates that he was not only an influential scholar, but also a generous, kind, decent human being.

Apart from his visualization work, I loved Wilkinson’s voice in a report written mostly by him on behalf of the American Psychological Association’s 1999 Task Force on Statistical Inference. Here’s the note I wrote myself when I first ran across this report, and I still stand by it:

This is a really great, short, but fairly complete overview of major components in a statistical study...
i.e., the things you want your junior statistician colleague to know without being told...
i.e., the things we ought to teach AND MEASURE ON our stats students.

Two of my favorite quotes from that report:

“Statistical power does not corrupt.”

and

The main point of this example is that the type of “atheoretical” search for patterns that we are sometimes warned against in graduate school can save us from the humiliation of having to retract conclusions we might ultimately make on the basis of contaminated data. We are warned against fishing expeditions for understandable reasons, but blind application of models without screening our data is a far graver error.

I had the incredible good fortune of meeting Wilkinson myself at a conference, though regrettably just once. This was SDSS 2019 in Seattle—the last conference I attended in person before the pandemic. One groggy morning, I stepped away from my conference breakfast table to get a second cup of coffee. I came back to find that Wilkinson had just sat down, thinking the table was empty. We ended up having a genuinely delightful conversation. I asked how he had managed to combine so many fascinating strands of work in his career, and he told me it had been a roundabout path: if I remember correctly, he had dropped his math major in his first week of college and switched to English; then later dropped out of divinity school; then just barely finished Psychology graduate school because he couldn’t stop tinkering with computers instead; then became a statistical software entrepreneur… He also reminisced fondly about attending conferences as a young researcher, where he got to hear giants in the field get drunk at the open bar and tell their life story 😛 Wilkinson was a witty and warm conversation partner. After breakfast he invited me to keep in touch, and I deeply regret that I never followed up. Rest in peace, Leland Wilkinson.

Call for papers for 2021 NeurIPS workshop on ML for the Developing World, themed around Global Challenges

I’m pleased to share that there will be a fifth NeurIPS workshop on Machine Learning for the Developing World (ML4D). This year’s call for papers has the theme of “Global Challenges.” What role can ML play in tackling global challenges such as COVID-19 or climate change, which affect the whole world but which have distinct local consequences in developing nations?

This year, ML4D is adding a new submission track: besides short papers, there is a new category of “problem pitches”:

Problem Pitches: We also welcome submissions of 1-2 page problem pitches outlining background, scope, and feasibility of a newly proposed research project along with the underlying research problem. The problem pitches track allows for direct feedback on new and proposed research, with the goal of better integrating researchers from low-income countries and research on development issues into the machine learning community. For that purpose, accepted submission will be paired with a dedicated project mentor. On the day of the workshop, mentors and attending community members will be able to give feedback on the problem pitches in topic-specific breakout sessions.

Please see the abstract below. If you have relevant work to share, consider submitting a 3-5 page short paper or a 1-2 page problem pitch by September 25th, 2021. The workshop will take place sometime during December 6-14, 2021.

While some nations are regaining normality after almost a year and a half since the COVID-19 pandemic struck as a global challenge –schools are reopening, face mask mandates are being dropped, economies are recovering, etc … –, other nations, especially developing ones, are amid their most critical scenarios in terms of health, economy, and education. Although this ongoing pandemic has been a global challenge, it has had local consequences and necessities in developing regions that are not necessarily shared globally. This situation makes us question how global challenges such as access to vaccines, good internet connectivity, sanitation, water, as well as poverty, climate change, environmental degradation, amongst others, have and will have local consequences in developing nations, and how machine learning approaches can assist in designing solutions that take into account these local particularities.

Past iterations of the ML4D workshop have explored: the development of smart solutions for intractable problems, the challenges and risks that arise when deploying machine learning models in developing regions, and building machine learning models with improved resilience. This year, we call on our community to identify and understand the particular challenges and consequences that global issues may result in developing regions while proposing machine learning-based solutions for tackling them.

Additionally, as part of COVID-19 global and local consequences, we will dedicate part of the workshop to understand the challenges in machine learning research in developing regions since the pandemic started. We also aim to support and incentivise ML4D research while considering the current challenges by including new sections such as a guidance and mentorship session for project proposals and a round table session focused on understanding the challenges faced by researchers in our community.

Call for papers on ML for the Developing World, themed around Improving Resilience

Once again, I am happy to share this year’s call for papers for the NeurIPS workshop on Machine Learning for the Developing World (ML4D). The 2020 workshop’s theme is “Improving Resilience.”

Please see the abstract below. If you have relevant work to share, consider submitting a 3-4 page short paper by October 2nd, 2020. The workshop will take place on Dec 11 or 12, near the end of NeurIPS 2020.

Machine Learning for the Developing World (ML4D): Improving Resilience

A few months ago, the world was shaken by the outbreak of the novel Coronavirus, exposing the lack of preparedness for such a case in many nations around the globe. As we watched the daily number of cases of the virus rise exponentially, and governments scramble to design appropriate policies, communities collectively asked “Could we have been better prepared for this?” Similar questions have been brought up by the climate emergency the world is now facing.

At a time of global reckoning, this year’s ML4D program will focus on building and improving resilience in developing regions through machine learning. Past iterations of the workshop have explored how machine learning can be used to tackle global development challenges, the potential benefits of such technologies, as well as the associated risks and shortcomings. This year we seek to ask our community to go beyond solely tackling existing problems by building machine learning tools with foresight, anticipating application challenges, and providing sustainable, resilient systems for long-term use.


This one-day workshop will bring together a diverse set of participants from across the globe. Attendees will learn about how machine learning tools can help enhance preparedness for disease outbreaks, address the climate crisis, and improve countries’ ability to respond to emergencies. It will also discuss how naive “tech solutionism” can threaten resilience by posing risks to human rights, enabling mass surveillance, and perpetuating inequalities. The workshop will include invited talks, contributed talks, a poster session of accepted papers, breakout sessions tailored to the workshop’s theme, and panel discussions.

Call for papers: NeurIPS 2019 Workshop on ML for the Developing World

I’m pleased to share a call for papers for the NeurIPS 2019 workshop on Machine Learning for the Developing World (ML4D).

This will be the 3rd year for this workshop, which brings together researchers who employ ML methods in developing-world settings, study the societal impacts of new technology, or develop algorithms to handle with common constraints in the developing world (such as limited data storage or computational power).

If you have relevant projects to present at the workshop, I encourage you to submit a 2-4 page short paper by September 13. The workshop will take place on Dec 13 or 14, near the end of NeurIPS 2019 in Vancouver, BC, Canada. Travel award funding is also available.

Tapestry 2016 conference: overview and keynote speakers

Overview

Encouraged by Robert Kosara’s call for applications, I attended the Tapestry 2016 conference two weeks ago. As advertised, it was a great chance to meet others from all over the data visualization world. I was one of relatively few academics there, so it was refreshing to chat with journalists, industry analysts, consultants, and so on. (Journalists were especially plentiful since Tapestry is the day before NICAR, the Computer-Assisted Reporting Conference.) Thanks to the presentations, posters & demos, and informal chats throughout the day, I came away with new ideas for improving my dataviz course and my own visualization projects.

I also presented a poster and handout on the course design for my Fall 2015 dataviz class. It was good to get feedback from other people who’ve taught similar courses, especially on the rubrics and assessment side of things.

The conference is organized and sponsored by the folks at Tableau Software. Although I’m an entrenched R user myself, I do appreciate Tableau’s usefulness in bringing the analytic approach of the grammar of graphics to people who aren’t dedicated programmers. To help my students and collaborators, I’ve been meaning to learn to use Tableau better myself. Folks there told me I should join the Pittsburgh Tableau User Group and read Dan Murray’s Tableau Your Data!.

Below are my notes on the three keynote speakers: Scott Klein on the history of data journalism, Jessica Hullman on research into story patterns, and Nick Sousanis on comics and visual thinking vs. traditional text-based scholarship.
My next post will continue with notes on the “short stories” presentations and some miscellaneous thoughts.

Continue reading “Tapestry 2016 conference: overview and keynote speakers”

Tapestry 2016 materials: LOs and Rubrics for teaching Statistical Graphics and Visualization

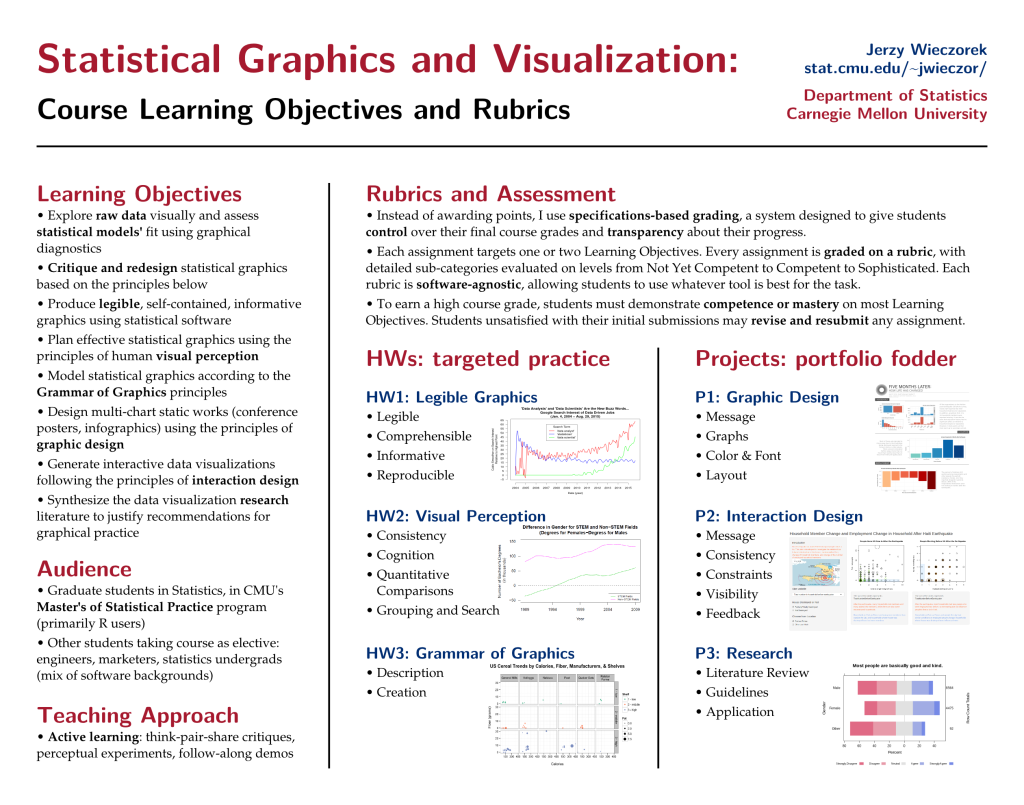
Here are the poster and handout I’ll be presenting tomorrow at the 2016 Tapestry Conference.

Poster "Statistical Graphics and Visualization: Course Learning Objectives and Rubrics"

My poster covers the Learning Objectives that I used to design my dataviz course last fall, along with the grading approach and rubric categories that I used for assessment. The Learning Objectives were a bit unusual for a Statistics department course, emphasizing some topics we teach too rarely (like graphic design). The “specs grading” approach1 seemed to be a success, both for student motivation and for the quality of their final projects.

The handout is a two-sided single page summary of my detailed rubrics for each assignment. By keeping the rubrics broad (and software-agnostic), it should be straightforward to (1) reuse the same basic assignments in future years with different prompts and (2) port these rubrics to dataviz courses in other departments.

I had no luck finding rubrics for these learning objectives when I was designing the course, so I had to write them myself.2 I’m sharing them here in the hopes that other instructors will be able to reuse them—and improve on them!

Any feedback is highly appreciated.


Footnotes:

Dataviz contest on “Visualizing Well-Being”

Someone from OECD emailed me about a data visualization contest for the Wikiprogress website (the deadline is August 24th):

Visualizing Well-Being contest

I am contacting you on behalf of the website Wikiprogress, which is currently running a Data Visualization Contest, with the prize of a paid trip to Mexico to attend the 5th OECD World Forum in Guadalajara in October this year. Wikiprogress is an open-source website, hosted by the OECD, to facilitate the exchange of information on well-being and sustainability, and the aim of the competition is to encourage participants to use well-being measurement in innovative ways to a) show how data on well-being give a more meaningful picture of the progress of societies than more traditional growth-oriented approaches, and b) to use their creativity to communicate key ideas about well-being to a broad audience.

After reading your blog, I think that you and your readers might be interested in this challenge. The OECD World Forums bring together hundreds of change-makers from around the world, from world leaders to small, grassroots projects, and the winners will have their work displayed and will be presented with a certificate of recognition during the event.

You can also visit the competition website here: http://bit.ly/1Gsso2y

It does sound like a challenge that might intrigue this blog’s readers:

  • think about how to report human well-being, beyond traditional measures like GDP;
  • find relevant good datasets (“official statistics” or otherwise);
  • visualize these measures’ importance or insightful trends in the data; and
  • possibly win a prize trip to the next OECD forum in Guadalajara, Mexico to network with others who are interested in putting data, statistics, and visualization to good use.

Forget NHST: conference bans all conclusions

Once again, CMU is hosting the illustrious notorious SIGBOVIK conference.

Not to be outdone by the journal editors who banned confidence intervals, the SIGBOVIK 2015 proceedings (p.83) feature a proposal to ban future papers from reporting any conclusions whatsoever:

In other words, from this point forward, BASP papers will only be allowed to include results that “kind of look significant”, but haven’t been vetted by any statistical processes…

This is a bold stance, and I think we, as ACH members, would be remiss if we were to take a stance any less bold. Which is why I propose that SIGBOVIK – from this day forward – should ban conclusions

Of course, even this provision may not be sufficient, since readers may draw their own conclusions from any suggestions, statements, or data presented by authors. Thus, I suggest a phased plan to remove any potential of readers being mislead…

I applaud the author’s courageous leadership. Readers of my own SIGBOVIK 2014 paper on BS inference (with Alex Reinhart) will immediately see the natural synergy between conclusion-free analyses and our own BS.

Belief-Sustaining Inference

TL;DR: If you’re in Pittsburgh today, come to SIGBOVIK 2014 at CMU at 5pm for free food and incredible math!

In a recent chat with my classmate Alex Reinhart, author of Statistics Done Wrong, we noticed a major gap in statistical inference philosophies. Roughly speaking, Bayesian statisticians begin with a prior and a likelihood, while Frequentist statisticians use the likelihood alone. Obviously, there is scope for a philosophy based on the prior alone.

We began to develop this idea, calling it Belief-Sustaining Inference, or BS for short. We discovered that BS inference is extremely efficient, for instance getting by with smaller sample sizes and producing tighter confidence intervals than other inference philosophies.

Today I am proud dismayed complacent to report that our resulting publication has been accepted to the prestigious adequate SIGBOVIK 2014 conference (for topics such as Inept Expert Systems, Artificial Stupidity, and Perplexity Theory):

Reinhart, A. and Wieczorek, J. “Belief-Sustaining Inference.” SIGBOVIK Proceedings, Pittsburgh, PA: Association for Computational Heresy, pp. 77-81, 2014. (pdf)

Our abstract:

Two major paradigms dominate modern statistics: frequentist inference, which uses a likelihood function to objectively draw inferences about the data; and Bayesian methods, which combine the likelihood function with a prior distribution representing the user’s personal beliefs. Besides myriad philosophical disputes, neither method accurately describes how ordinary humans make inferences about data. Personal beliefs clearly color decision-making, contrary to the prescription of frequentism, but many closely-held beliefs do not meet the strict coherence requirements of Bayesian inference. To remedy this problem, we propose belief-sustaining (BS) inference, which makes no use of the data whatsoever, in order to satisfy what we call “the principle of least embarrassment.” This is a much more accurate description of human behavior. We believe this method should replace Bayesian and frequentist inference for economic and public health reasons.

If you’re around CMU today (April 1st), please do stop by SIGBOVIK at 5pm, in Rashid Auditorium in the Gates-Hillman Center. There will be free food, and that’s no joke.