
Here are the poster and handout I’ll be presenting tomorrow at the 2016 Tapestry Conference.
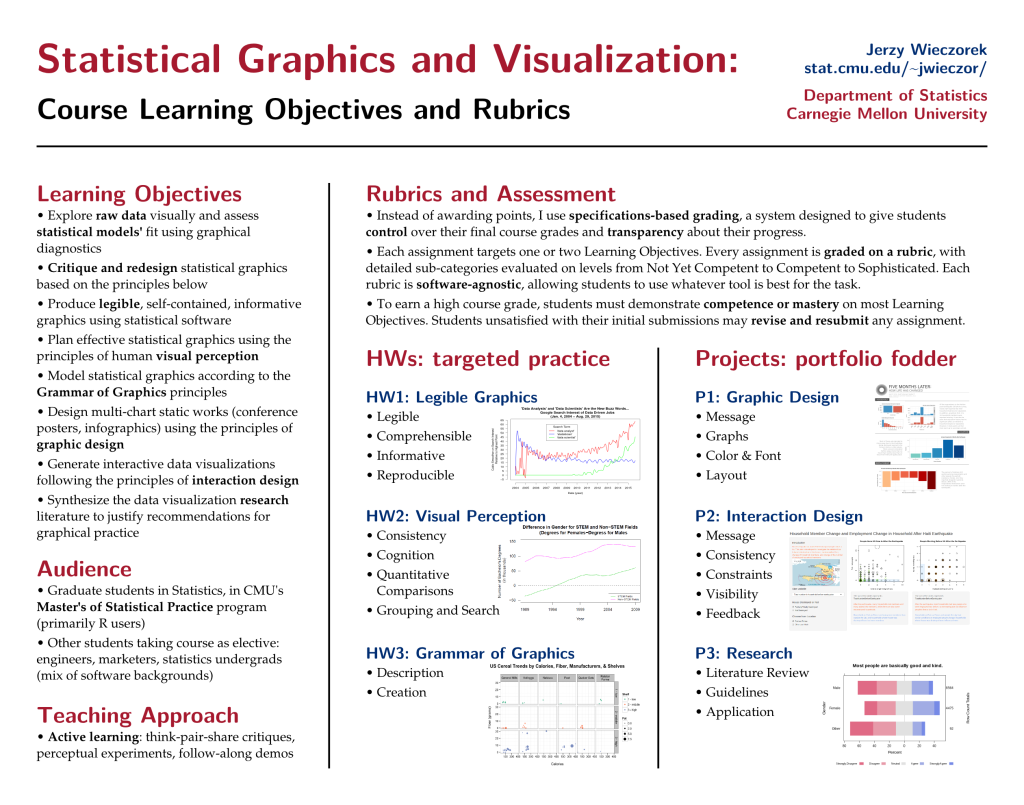
My poster covers the Learning Objectives that I used to design my dataviz course last fall, along with the grading approach and rubric categories that I used for assessment. The Learning Objectives were a bit unusual for a Statistics department course, emphasizing some topics we teach too rarely (like graphic design). The “specs grading” approach1 seemed to be a success, both for student motivation and for the quality of their final projects.
The handout is a two-sided single page summary of my detailed rubrics for each assignment. By keeping the rubrics broad (and software-agnostic), it should be straightforward to (1) reuse the same basic assignments in future years with different prompts and (2) port these rubrics to dataviz courses in other departments.
I had no luck finding rubrics for these learning objectives when I was designing the course, so I had to write them myself.2 I’m sharing them here in the hopes that other instructors will be able to reuse them—and improve on them!
Any feedback is highly appreciated.
Footnotes: