We’re hiring for a tenure-track faculty member in Statistics! Are you interested in teaching at a beautiful small liberal arts college in Maine? Are you looking for academic positions that value a balance of teaching & research — and provide resources to support you in both regards? Not to mention a competitive salary, good benefits, and all four seasons in a small New England town? Please do apply, and reach out to me with any questions, or share the ad with anyone you know who might be a good fit:
We will start reviewing applications on October 24 and continue until the position is filled.
(And if you’re not just a solo statistician, but you are working on a two-body problem with a computationally-focused partner, then let me also note that both our Davis AI Institute and our CS department are hiring too this year.)
Some new developments since last time we had a faculty search in Statistics:
In addition to our Data Science minor, we are close to approving a Data Science major in collaboration with Colby’s departments of Mathematics and of Computer Science
In terms of research, there are generous startup funds (more than I’ve been able to use so far) and plenty of other support for research materials, conference travel, etc.
The teaching load is 9 courses every 2 years. That comes out to 2 courses most semesters, and 3 every fourth semester. While we provide regular offerings of Intro Stats, Statistical Modeling, and other core courses, in a typical year each of us also gets to teach a favorite elective or two. For example, I have gotten to work on some great partnerships by planning Survey Sampling or Data Visualization courses with our Civic Engagement office. My students have shown care, respect, and insight as they help our local homeless shelter study what resources improve housing outcomes; or help our town fire department to survey citizens and local businesses to inform its five-year plan.
And frankly, it’s just plain fun to work across disciplines. I’ve help a Government major figure out how to collect & analyze a random sample of news articles for a project on public transport in Central America. I’ve helped a Biology professor figure out how to bootstrap an imbalanced experiment on amoebas, and I’ve learned nifty nuggets of data visualization history from an English professor.
Long story short: I really do enjoy teaching statistics in the liberal arts college environment. If you think you would too, come join us!
Once again, we are hiring a tenure-track statistician here at Colby College, in the Department of Mathematics and Statistics! I should have posted this sooner; but if you are looking for an opportunity to teach Statistics and Data Science at a strong liberal arts college with great students and colleagues, please consider applying:
We will give full consideration to applications received by this Monday, October 14, but review will continue until the position is filled. If you have concerns about making this deadline, or if you have any other questions, please do get in touch: jawieczo@colby.edu … I would also be happy to answer any questions about the position, Colby College, or our city of Waterville, Maine.
Some things that I am particularly excited about this year:
a recent multi-million-dollar gift that is funding Data Science courses, curricular development, speakers, and other activities — and strong encouragement to spend that gift on interdisciplinary projects with colleagues across campus (for example, I have co-organized a data visualization workshop with faculty in Biology and proposed a first-year course cluster to be co-taught with faculty in English);
It’s a strange thing to finish a thesis. You came in to grad school hoping, maybe even expecting, to make a grand contribution—a deep insight into the nature of the world. But Borges puts it best:
…the tall, haughty volumes that made a golden dimness in the corner of his room were not (as his vanity had dreamed them) a mirror of the world, but just another thing added to the world’s contents.
For that matter, when do you really “finish”? The dissertation is pretty much written — then a few weeks later the slides are ready — then the defense itself takes place — then you make revisions — then there’s a graduation ceremony — and even then, there remain a few minor “suggested” revisions I haven’t done yet but should do before getting it printed & bound & archived. [That finally happened half a year later, over January break, long after the PhD was “over.”]
Not to mention, my status felt weirdly ambiguous. The faculty at Colby have already hired me and seem to treat me as basically a colleague, pending the minor formality of defending. And at CMU I’m also teaching a course and students are calling me “Professor.” But of course, everyone else in the department is used to treating me as a student, so I feel very much like one. Admittedly, during the few weeks when I was no longer a “PhD Candidate” but not yet officially “Dr Wieczorek,” I enjoyed the brief chance to introduce myself as a “Graduand” 🙂
But it’s all very anticlimactic! There’s no trumpet fanfare saying: “NOW you are done.” If anything, it felt like the first Zelda game’s end music (starting about 20 sec into the clip below):
As you’ve played the game through, you’ve died many many times along the way, and Link’s death lullaby has been playing so long in all your lowest moments that you don’t even really hear it anymore. Then here it returns, after you thought you were done. Not this again?!? Yet suddenly your ears catch a faint counterpoint that wasn’t there before. This new bass line changes the character of the music completely, getting stronger and stronger, until somehow it has become a jazzy, celebratory tune. There’s no one moment of enlightenment, but a weary transition as the world slowly starts looking better and better.
Teaching
While I didn’t finish as much of the thesis last fall as I expected, it was supposed to be my focus this spring (along with the new baby!), with only minimal grading responsibilities as a TA.
HOWEVER… a week before spring term started, a last-minute shift in staffing became necessary and I was asked to teach 36-315, Statistical Graphics and Visualization—a hundred-student undergraduate class. I really should have said No (the chair told me it’s okay to say No!), but still, the department seemed to be at a loss, and I didn’t want to let them down after all they had done for me throughout my time at CMU. So instead, I found myself focused on teaching the largest class I’ve had yet, while just scraping by on both research and parenting.
This spring I also finished the last requirement for the Eberly Center’s Future Faculty Program. It was a bit funny to have to revise my Statement of Teaching Philosophy several times, given that I’d already written one that got me a job, but it does feel good to wrap this up formally. The program made a big impact on my teaching over the past few years, and I’m glad I can contribute to their completion rate.
Other projects
We continued our Teaching Statistics research, running many more think-aloud interviews, and presented our work at eCOTS 2018 (the Electronic Conference on Teaching Statistics).
I also traveled back to DC, to the Census Bureau, to give a talk on my paper with Tommy Wright and Martin Klein. The paper is about visualizations designed to help readers make many comparisons in a statistically-appropriate way. The talk was recorded, and now I see the video has been posted as part of a new “Census Academy” resource.
Life
The baby went through a rough patch where he wouldn’t fall sleep unless someone was holding him and moving around—sitting wasn’t good enough. Somehow I discovered that I could hold him while playing Crypt of the NecroDancer, which is basically a mashup of Dance Dance Revolution and Legend of Zelda: you use the arrow keys to move your dungeon-explorer in time with the beat of this amazing techo-ish soundtrack. I would play with one hand, standing and rocking back and forth to help myself stick to the beat, and the little guy would just fall asleep contentedly while I repeatedly destroyed got killed by skeletons and slime monsters.
Despite everyone’s sensible advice, we went house-hunting in Maine in mid-March—when all the houses were covered in 3 feet of snow—because spring break was the only time I could get away. Surprisingly, nobody else was house-hunting there that week 🙂 and as it turned out, we found a wonderful home at a very reasonable price. Our landlord in Pittsburgh has been wonderful, but we’re excited to become homeowners.
Comics
So, at this point you might be wondering: Is a PhD degree in Statistics worthwhile?
Someday I’ll follow up with a post on that, akin to my MS degree post. Meanwhile, Matt Might has the best post on the value of a PhD in general.
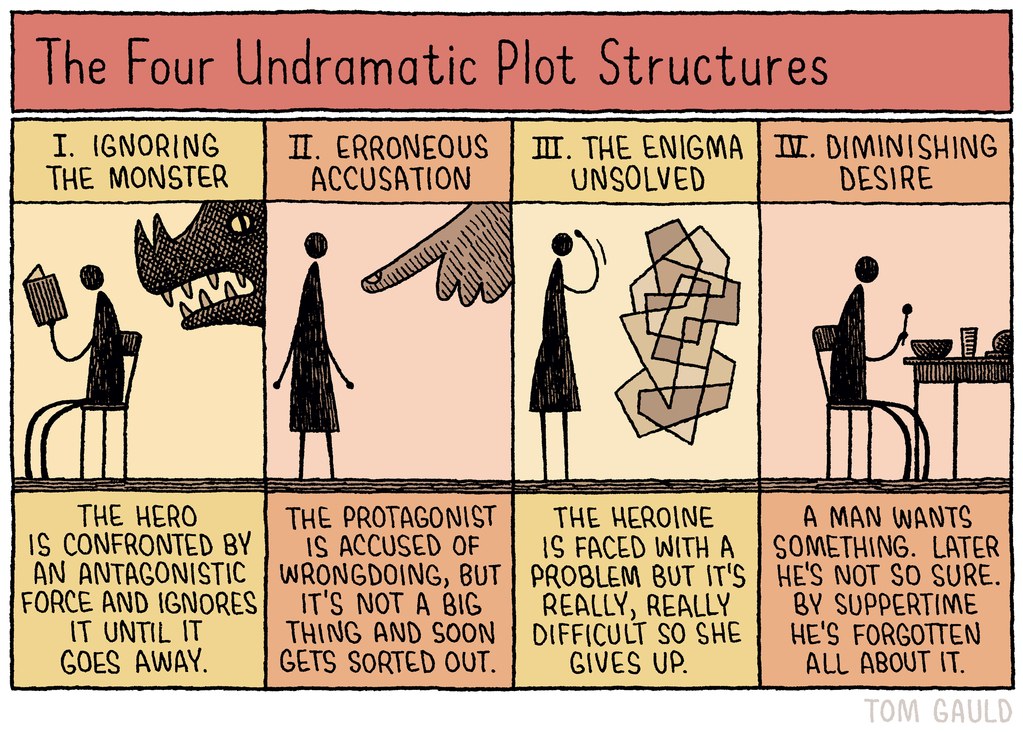
But for today, I will leave you with some comics that kept me crying smiling during the tough times of a PhD. Of course, PHD Comics (aka Piled Higher and Deeper) and XKCD both go without saying, but here are a few others that felt relevant.
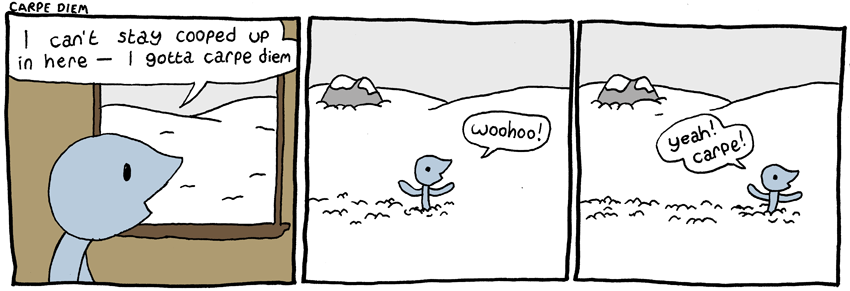
When you’re starting down this precarious road:
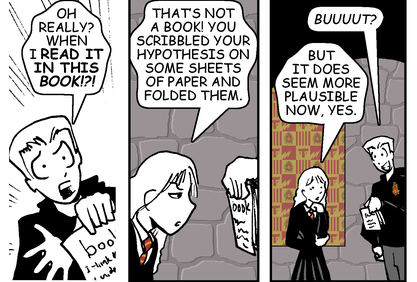
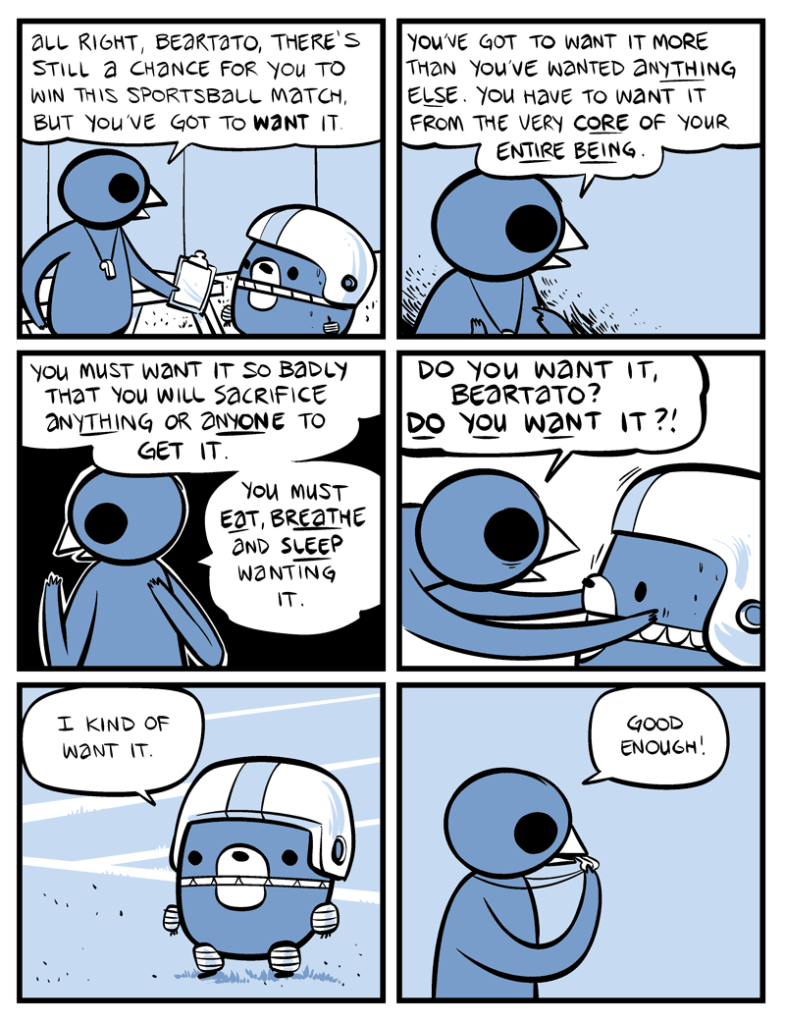
When you forget why you’re even doing this:
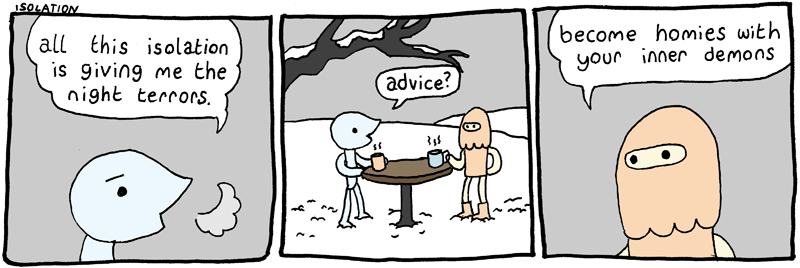
When you have spent years with almost no human company besides other academics no human company:
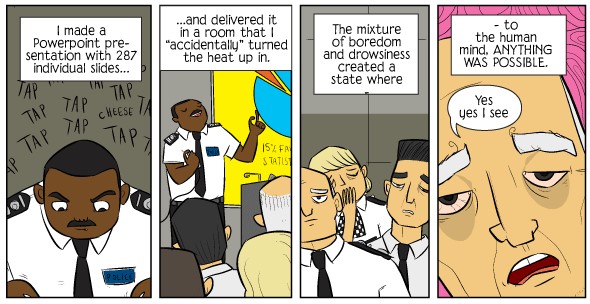
When you are suddenly expected to interview for jobs with bona fide humans, after spending years around aforementioned academics:
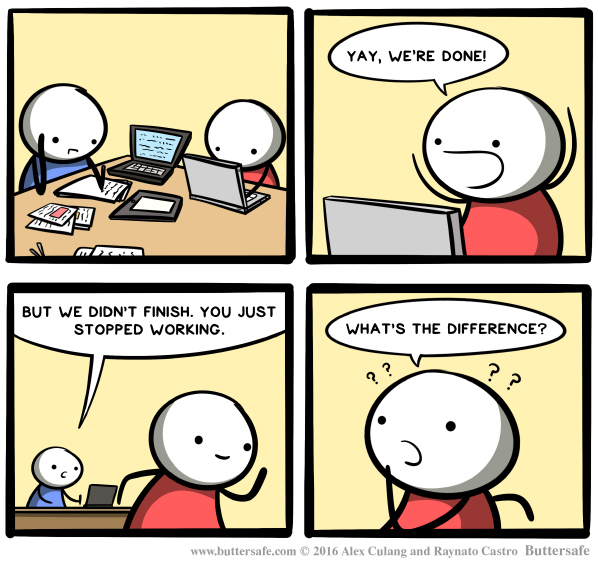
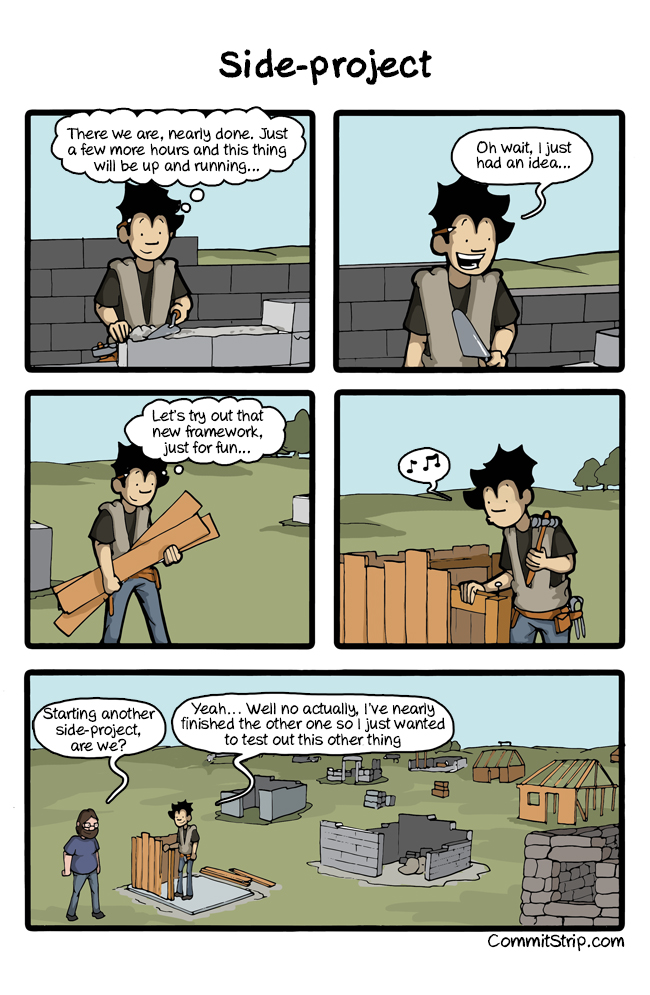
When you are neeeeeearly done, and if you could just focus on your existing responsibilities you’d be able to wrap them up:
When you somehow manage to buckle down and knock out a ton of research/writing like a boss:
When you finally submit the damned dissertation:
When you are as ready as you’ll ever be for the thesis defense:
When you look back on your time as a PhD student with a note of defiant optimism:
The final year! Our 2nd baby was on the way, and the job search was imminent. Oh, and by the way there’s this little thing called “finishing your dissertation”…
Previous posts: the 1st, 2nd, 3rd, 4th, 5th, 6th, 7th, and 8th semesters of my Statistics PhD program.
Research
This year my advisor was able to place me on half-TA’ing grant support. So I asked to have all my TA’ing pushed to the spring, with the intent of finishing the bulk of my thesis work this fall. I figured that in the spring I’ll be OK to grade 10 hrs/wk on my own time while helping with the new baby (due in Dec), as long as the thesis is mostly done.
However, job hunting took a HUGE amount of time. That’ll be its own post. (Also the spring TA duties turned into something larger, but that’s a story for the next post.)
In other words, thesis research progress was… minimal, to put it mildly.
Other projects
Well, OK, so there’s another reason my thesis work was slow: I jumped onto two new short-term projects that (1) were very much in my wheelhouse, and (2) seemed like great fodder for job applications and interviews. Both of them arose thanks to Ryan Tibshirani. Unsurprisingly, it turns out that it’s GREAT for a grad student to be on good terms with a well-known professor who gets too many requests for interesting projects and occasionally passes them on to students. In both cases, it was fantastic of Ryan to think of me, and although it’s been tough to be doing it just right now, this is legitimately the kind of research I want to do later on (and probably should have done for my thesis in the first place! argh…).
First, knowing that I’m interested in education, Ryan asked if I’d like to help with some consulting for Duolingo, the language-learning app company (also founded by CMU folks and still Pittsburgh-based). The folks there had some interesting questions about experimental design and suitable metrics for A/B testing their app. One of our contacts there was Burr Settles, who wrote a helpful book on Active Learning (the ML technique, not the pedagogy). We had some good discussions after digging into the details of their problem: challenges of running permutation tests on massive datasets, whether old-school tests like sign-rank tests would be better for their goals, how the data-over-time structure affects their analyses, etc. These chats even led me to an old Portland State classmate’s work regarding how to get confidence intervals from a permutation test, and I have some ideas for extensions on that particular problem.
Second, knowing that I had experience with survey data, Ryan passed on to me an email request to review some new methodology. Varun Kshirsagar, working on the Poverty Probability Index (PPI), had made some revisions to this poverty-tracking method and wanted to get feedback from someone who understood both modern statistics & machine learning tools as well as the kind of complex-survey-design datasets used to estimate the PPI models. It was a real pleasure working with Varun, and thinking about how to combine these two worlds (ML and survey data) had been a huge part of my motivation to go back to grad school in the first place and attend CMU in particular. We wrote up a short paper on the method for the NIPS 2017 workshop on ML for the Developing World, and we won the best paper award 🙂 I plan to revisit some of these ideas in future research: How do we run logistic-regression lasso or elastic net with survey-weighted data? How should we cross-validate when the survey design is not iid?
Teaching
Alex and I also continued running the Teach Stats mini. This semester we decided it was a bit embarrassing that Statistics, of all fields, doesn’t have a better standardized assessment of what students are learning in our intro courses. Without such a tool, it’s hard to do good pedagogy research and give strong evidence about whether your interventions / new methods have any impact.
There are already a couple of assessment instruments out there, but most were written by psychologists or engineers rather than by statisticians. Also, many of their questions are procedural, rather than about conceptual understanding. Even though these assessments have passed all the standard psychometric tests, there’s no guarantee that whatever they measure is actually the thing we’d *like* to measure.
So we started discussing what we’d like to measure instead, drafting questions, and planning out how we would validate these questions. Inspired by my own experiences in user-experience research at Olin and Ziba, and with the help of an article on writing good assessments for physics education by Adams and Wieman, we started planning think-aloud studies. The idea is to watch students work through our problems, talking out loud as they do so, so that we can see where they trip up. Do they get it wrong just because the question is poorly worded, even if they understand the concept? Do they get it right just because you can eliminate some choices immediately, even if they don’t understand the concept at all?
We ran a pilot study this fall, and at the end of the semester, I had my first chance to help draft an IRB application—hurrah for statisticians actually working on research design!
This summer and fall, I also kept up with an informal History of Stats reading group organized by fellow PhD student Lee Richardson. Again, these journal-clubs and reading-groups have been my favorite part of the PhD curriculum, and I wish more of our “real” classes had been run this way.
Life
?!? “Life”? Not much that I can recall this semester.
Next up
The 10th and final semester of my Statistics PhD program.
I realize this is over 2 years late, but I found these drafts sitting around and perhaps they are still worth posting.
Apologies for the negativity! I have to admit this was one of the toughest semesters for me, psychologically. I thought about toning it down, especially since I’m delighted to be where I am now—tenure track faculty at a small liberal arts college—but I don’t want to pretend it’s been easy to get here.
I believe this was the semester I was going to CMU’s Counseling and Psychological Services (CaPS). If you’re a grad student, I recommend that you get to know such resources on your campus. Just about everyone faces the all-pervasive impostor syndrome, which compounds any other specific challenges you might have personally, and it’s helpful to be able to talk through it all with someone experienced.
Previous posts: the 1st, 2nd, 3rd, 4th, 5th, 6th, and 7th semesters of my Statistics PhD program.
Life
The more my son grows up, the more the PhD starts to feel like an overwhelming distraction from real life. One day I got home late and my wife told me what he’d been singing:
“Old MacDonald had a daddy, E-I-E-I-O, with a work-work here and a work-work there…” 🙁
If you have a family while in grad school, you will often feel that either the PhD doesn’t come first, or your family doesn’t come first. The academic folks around you will lean towards the PhD coming first, which of course partly makes sense—if you’re not making the fullest use out of your limited time in grad school, why bother going at all?—but it’s also hugely selection bias. Many (though not all) of the faculty who land and stay at a top research university are people who did decide that work comes first.
Thankfully, nobody has ever sneered to my face that “Ah well, not everyone’s cut out for academia” (though I’ve heard of it happening in other departments). But I feel it in my head all the time. (And I overhear younger students dismissing 30+ year olds like myself as too old to do good research… And I see the offices full every evening and weekend…) At another stage in life, my reaction might have been, “Oh yeah? I’ll show you, I’ll work my butt off and prove I’m good enough to cut it!” But now, my reaction is, “I’ve got better things to do than play this petty game.” Yes, I’ll plod along and finish the PhD I’ve started—perseverance counts for a lot—but right now I am not eager to stretch out this stage of life any longer than necessary.
Research
Reading Thinking, Fast and Slow, I am noting the constant mentions of the author’s collaboration with Amos Tversky. I think I’ve been way too focused on self-sufficiency here. It’s true that to get the thesis, I need to demonstrate I can do the work on my own… BUT in order to actually succeed afterwards (whether in academia or not), I’ll need to collaborate with others, not just myself and advisor. Plus, it’s simply more fun, spending those hours tackling a tough problem with an equally interested collaborator! So, my plan starting this summer and into next year: Add a few collaborative projects—finish FPS with Daren, finish DL with Nick and Jordan, revisit CIs/AIPE with Alex, start something (visual inference? CV with confidence?) with Justin… [Looking back, I regret that I did not follow up and make most of these planned collaborations happen while I was still a student!]
Jing still amazes me with his quick insight and intuition about how to tackle a proof. When I get stuck after spending hours on something, it takes him almost no time to see: if we back up a few steps to this other point, and tackle that instead, it’ll be much cleaner. This trait is taking me a long time to learn.
Daren argues that technical math prowess is definitely not sufficient (good ideas of *what* to study are more important), but also not necessary (even theory-wizards like Yenchi and Ale have to constantly look up things they’ve forgotten). I disagree a bit: I really think fluency in the big-picture math concepts is important—if I have memorized the definition of an eigenvalue, but not internalized its *meaning*, then I will never see big-picture ideas quickly enough, nor know how to start proving technical details, nor recall where to find those details in work I’ve seen before. It’s like when I play clarinet: I don’t need to memorize the piece I’m playing—sheet music is fine—but I *do* need to memorize the basics. I simply cannot play in real-time if I have to refer back to a fingering chart for every single note! In Joel Spolsky’s words (although see Lang’s actual article too):
Serge Lang, a math professor at Yale, used to give his Calculus students a fairly simple algebra problem on the first day of classes, one which almost everyone could solve, but some of them solved it as quickly as they could write while others took a while, and Professor Lang claimed that all of the students who solved the problem as quickly as they could write would get an A in the Calculus course, and all the others wouldn’t. The speed with which they solved a simple algebra problem was as good a predictor of the final grade in Calculus as a whole semester of homework, tests, midterms, and a final.
You see, if you can’t whiz through the easy stuff at 100 m.p.h., you’re never gonna get the advanced stuff.
It’s also hitting me how stupidly selfish I’ve been here. As much as I’d like to think so, I didn’t come here to solve practical problems and make the world a better place. If I had, I’d have started right off the bat, using (and honing) skills I *do* have, working in the Census research group to make serious progress on applied problems. Instead, I wanted to bone up on my math-theory side, just thinking about the glory of proving theorems, but without putting in the prep work. It’s true that I’ve learned a lot by working on theory problems with Jing—but I would have been so much more productive if I’d taken a few hardcore math classes first, brushing up on my weak spots *before* starting such research. (I took linear algebra over a decade before starting the PhD, and it really shows. Yes, I can multiply matrices, but the advanced stuff has been a real slog.) I’ve spent a couple of years now on work that other students could have done much faster and enjoyed more, while neglecting to make real contributions using the skills I *do* have. In other words, I wish I could go back and tell myself: *either* just take some math classes (or even get a MS in Math?), until you can do the theory on your own (or with a mentoring colleague at work), and skip the Stats PhD… *or* do the PhD in a way that builds on your strengths (and makes real contributions!), not merely papers over your weaknesses. Sadly, I probably wouldn’t have believed me. My teaching experiences and the Eberly center seminars have been wonderful, but otherwise, right now I feel I have not made good use out of my time here. (Even in my neuroscience ADA project flop, only a few logistical challenges were out of my hands—and I could have overcome most of them by gritting my teeth and learning Python well, and by sitting alongside the scientists in the lab.) Hindsight is 20/20, and everyone goes through impostor syndrome, but still…
The course largely followed Cosma’s (draft) textbook Advanced Data Analysis from an Elementary Point of View. It was good for me to be “forced” to read up a little on causal inference and related topics. I’m still no expert, but at least not clueless. I also liked his perspective of statistical modeling as “data compression,” and his view of regression as a linear smoother with *weird* weights.
Some students mentioned that having to code up cross-validation from scratch 5 times or more was a *good* part of the class. They really feel they understand it now, more so than other things which they never or rarely had to code directly—such as backfitting in GAMs. I worried that repeatedly writing CV from scratch would start to feel like busywork, but luckily not (at least for these few students). And I felt the same about taking the Convex Optimization class myself: it’s great to have repeated practice *coding up the algorithms directly* and understanding what they’re trying to do, even if it’s only practice and in reality you’d actually use a pre-canned routine that deals with subtleties such as numerical convergence issues. So, in future years, we should give more opportunities to practice coding up algorithms, not just deriving theory about them and using them for data analysis. (Not to mention the omitted issues of data collection and power calculations…)
By the end of the semester, so many students still didn’t understand the idea of additive vs interaction models. They assumed “additive model” specifically means “GAM with spline terms” and “interaction model” means “linear regression with interaction terms.” We should hit these points harder earlier: “additive” means *any* model that is additive in the terms; and you can certainly do interactions within a GAM by having a multiple-predictor spline term; and so on.
If I’m going to be strict about not accepting late HWs, I should do so from the very beginning. It’ll (hopefully) save me ages of back-and-forth emails from students with excuses over the course of the semester. Also, if the promise of no-credit-for-late-HWs only kicks in at the end of semester, all of a sudden, then some students may have already used up their free dropped-HW opportunities, so they get a much lower grade than expected even if they *do* the work (but just submit it late). That’s not *technically* unfair (the syllabus did say we’d reject late HWs)… but it *feels* unfair. Best to set up consistent and clear expectations, right?
Likewise, if going to be serious about saying that “on time” means “at the start of class,” then have a TA pick up the HWs right at that time. We saw a trickle of late students (or all showing up at end of class) dumping in HWs after the fact. (Maybe electronic submission, with the deadline enforced by your course-management software, is not so bad.)
I’m pleased that we had decent turnaround time for grading most weeks—but it was sad that so many students never bothered to pick up graded HWs. We need better incentives to figure out your mistakes and learn from them, not merely be graded on them. (Alternately, it’s tempting to say that if you *don’t* pick up X of your early HWs, then you accept “stochastic grading” for the rest—we’ll give you a random grade and save time by not grading them manually!)
The Blackboard discussion forums were painful to set up and navigate. We should have used Piazza instead.
How would I grade such a class with specs-based grading? There are so many details to demonstrate understanding of, and so many ways to lose points on current assignments. How to get around point-grubbing here?
Other projects
I made no progress on the FPS paper with Daren, nor on the DL paper with Nick 🙁 At least the FPS paper was submitted to a conference… and rejected by reviewers who didn’t understand the purpose of the paper. I should have quickly revised the introduction to reframe our goals clearly and sent it somewhere else, but instead it’s been sitting on my desk.
This semester (or maybe near the end of last term?) I volunteered to join the GenEd committee. This is a mostly-faculty committee, revising the general education requirements in the CMU college (Dietrich College of Humanities and Social Sciences) to which our Statistics department belongs. It’s been eye-opening to see how faculty meetings go behind the scenes. (In particular, it’s fascinating that even top humanities scholars at a top department have trouble concisely defending the humanities as a GenEd requirement. There are also long digressions to quibble over a single word—“competence” is like a loaded gun, and even clearly-temporary placeholders like “Off-campus experiences” hold up the meeting interminably once someone points out that undergrad research also falls under that heading and it must be renamed right now…) But seriously, it’s been great to hear some truly remarkable educators discuss the direction of our programs, from broad goals to particular pedagogical methods. As a statistician, naturally I volunteered for the Assessment subgroup, and it has been so wonderful to work with experts like Marsha Lovett.
I did well in the “Three Minute Thesis” (3MT) competition! Grad students have 3 minutes and 1 slide to summarize their work for a wide audience. I was surprised and thrilled to win my preliminary round. Unfortunately the finals were the same date as an out-of-town trip I could not miss, so I did not get to compete further, but they still kindly gave me a prelim-round prize of research funds which I used for travel to USCOTS.
I presented my dataviz course poster at the US Conference on Teaching Statistics (USCOTS), in State College, PA. During the poster session I was pleased to meet several folks from stats departments looking to hire new faculty, and they seemed pleased to meet a grad student close to defending who is interested in both pedagogy and research. I believe this was my first contact with Chris Malone at Winona State University and KB Boomer at Bucknell University.
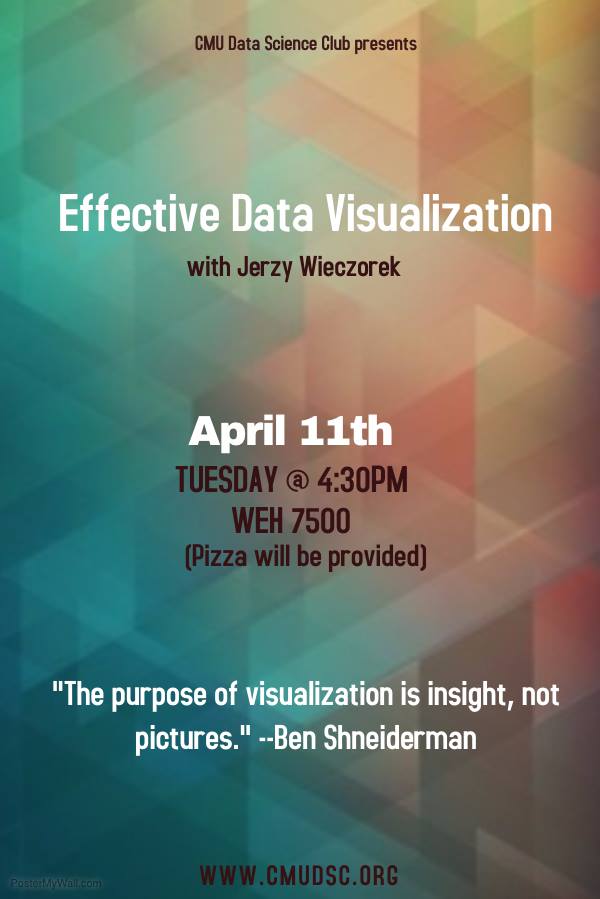
The CMU student-run Data Science Club also invited me to give a high-level talk on principles of good data visualization. Here are my slides, a checklist of best practices to follow, R code, and the nhanes and obesity_education CSV files.
Alex Reinhart and I proposed and ran a mini (half-semester course) on Teaching Statistics, with Rebecca Nugent advising. It was run mostly as a journal club—a good chance to read and discuss interesting papers on pedagogy in general as well as (introductory) statistics education in particular.
Finally, I had my first R package RankingProject accepted on CRAN! Together with Tommy Wright and Martin Klein, my former colleagues back at the Census Bureau, I have been working on a paper about ways to visualize data that lead to correct inferences about comparing many different estimates. This package contains the code and data to implement techniques we recommend in the paper, “A Primer on Visualizations for Comparing Populations, Including the Issue of Overlapping Confidence Intervals”[which went to print in May 2019 in The American Statistician]. The package also was listed as one of RStudio’s top 40 new packages in March 2017, and it has had a respectable number of downloads so far: total , with a monthly average of .
Next up
The 9th and 10th semesters of my Statistics PhD program.
Original post (October 2018): Xiao-Li Meng’s recent article on “Statistical Paradises and Paradoxes in Big Data (I)” has a fascinating approach to quantifying uncertainty in the Big Data setting. Here’s a very loose/oversimplified summary, along with an extreme example of applying some of these ideas. But I certainly encourage you to read the original paper itself.
We exhort our Intro Stats students: Don’t trust data from a biased sample! Yet in the real world, we rarely deal with datasets collected under a formal random sampling scheme. Sometimes we have e.g. administrative data collected from many people but only those who self-selected into the sample. Even when we do take a “proper” random survey, there is usually nonignorable non-response.
Meng tackles the question: When does a small random survey really give better estimates than a large non-random dataset? He frames the problem gracefully in a way which highlights the importance of two things: (1) the correlation between *whether* a person responds and *what* their response is, and (2) the overall population size N (not just the observed sample size n). Under simple random sampling, the correlation should be essentially 0, and the usual standard error estimates are appropriate. But when we have non-random sample selection, this correlation leads to bias in our estimates, in a way such that the bias gets *substantially worse* when the population is large and we have a large sampling fraction n/N.
Meng reframes the problem several ways, but my favorite is in terms of “effective sample size” or n_eff. For a particular n, N, and correlation, quantify the uncertainty in our estimate—then figure out what sample size from a simple random sample would give the same level of uncertainty. In an extended example around the 2016 US presidential election, Meng suggests that there was a small but non-zero correlation (around 0.005) between *whether* you responded to polling surveys and *which* candidate you supported, Trump or Clinton. This tiny correlation was enough to affect the polling results substantially. All the late election poll samples added up to about 2 million respondents, which at first seems like a massive sample size—naive confidence intervals would have tiny margins of error, less than 1/10th of a percentage point. Yet due to that small correlation of 0.005 (Trump voters were a tiny bit less likely to respond to polls than Clinton voters were), the effective sample size n_eff was around 400 instead, with a margin of error around 5 percentage points.
Let’s say that again: Final estimates for the percent of popular vote going to Trump vs Clinton were based on 2 million respondents. Yet due to self-selection bias (who agreed to reply to the polls), the estimates’ quality was no better than a simple random survey of only 400 people, if you could get a 100% response rate from those 400 folks.
On the other hand, if you want to try correcting your own dataset’s estimates and margins of error, estimating this correlation is difficult in practice. You certainly can’t do it from the sample at hand, though you can try to approximate it from several samples. Still, one rough estimate of n_eff gives some insight into how bad the problem can get.
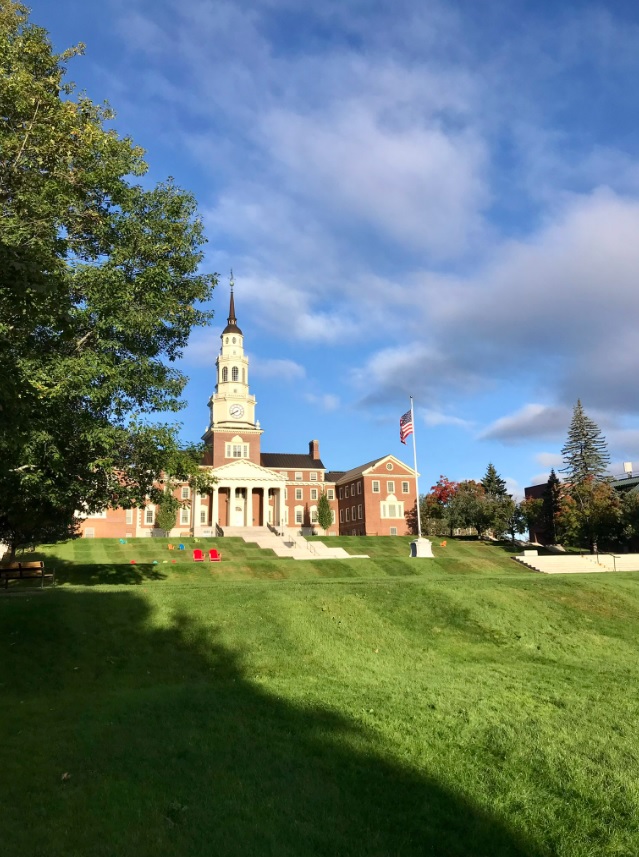
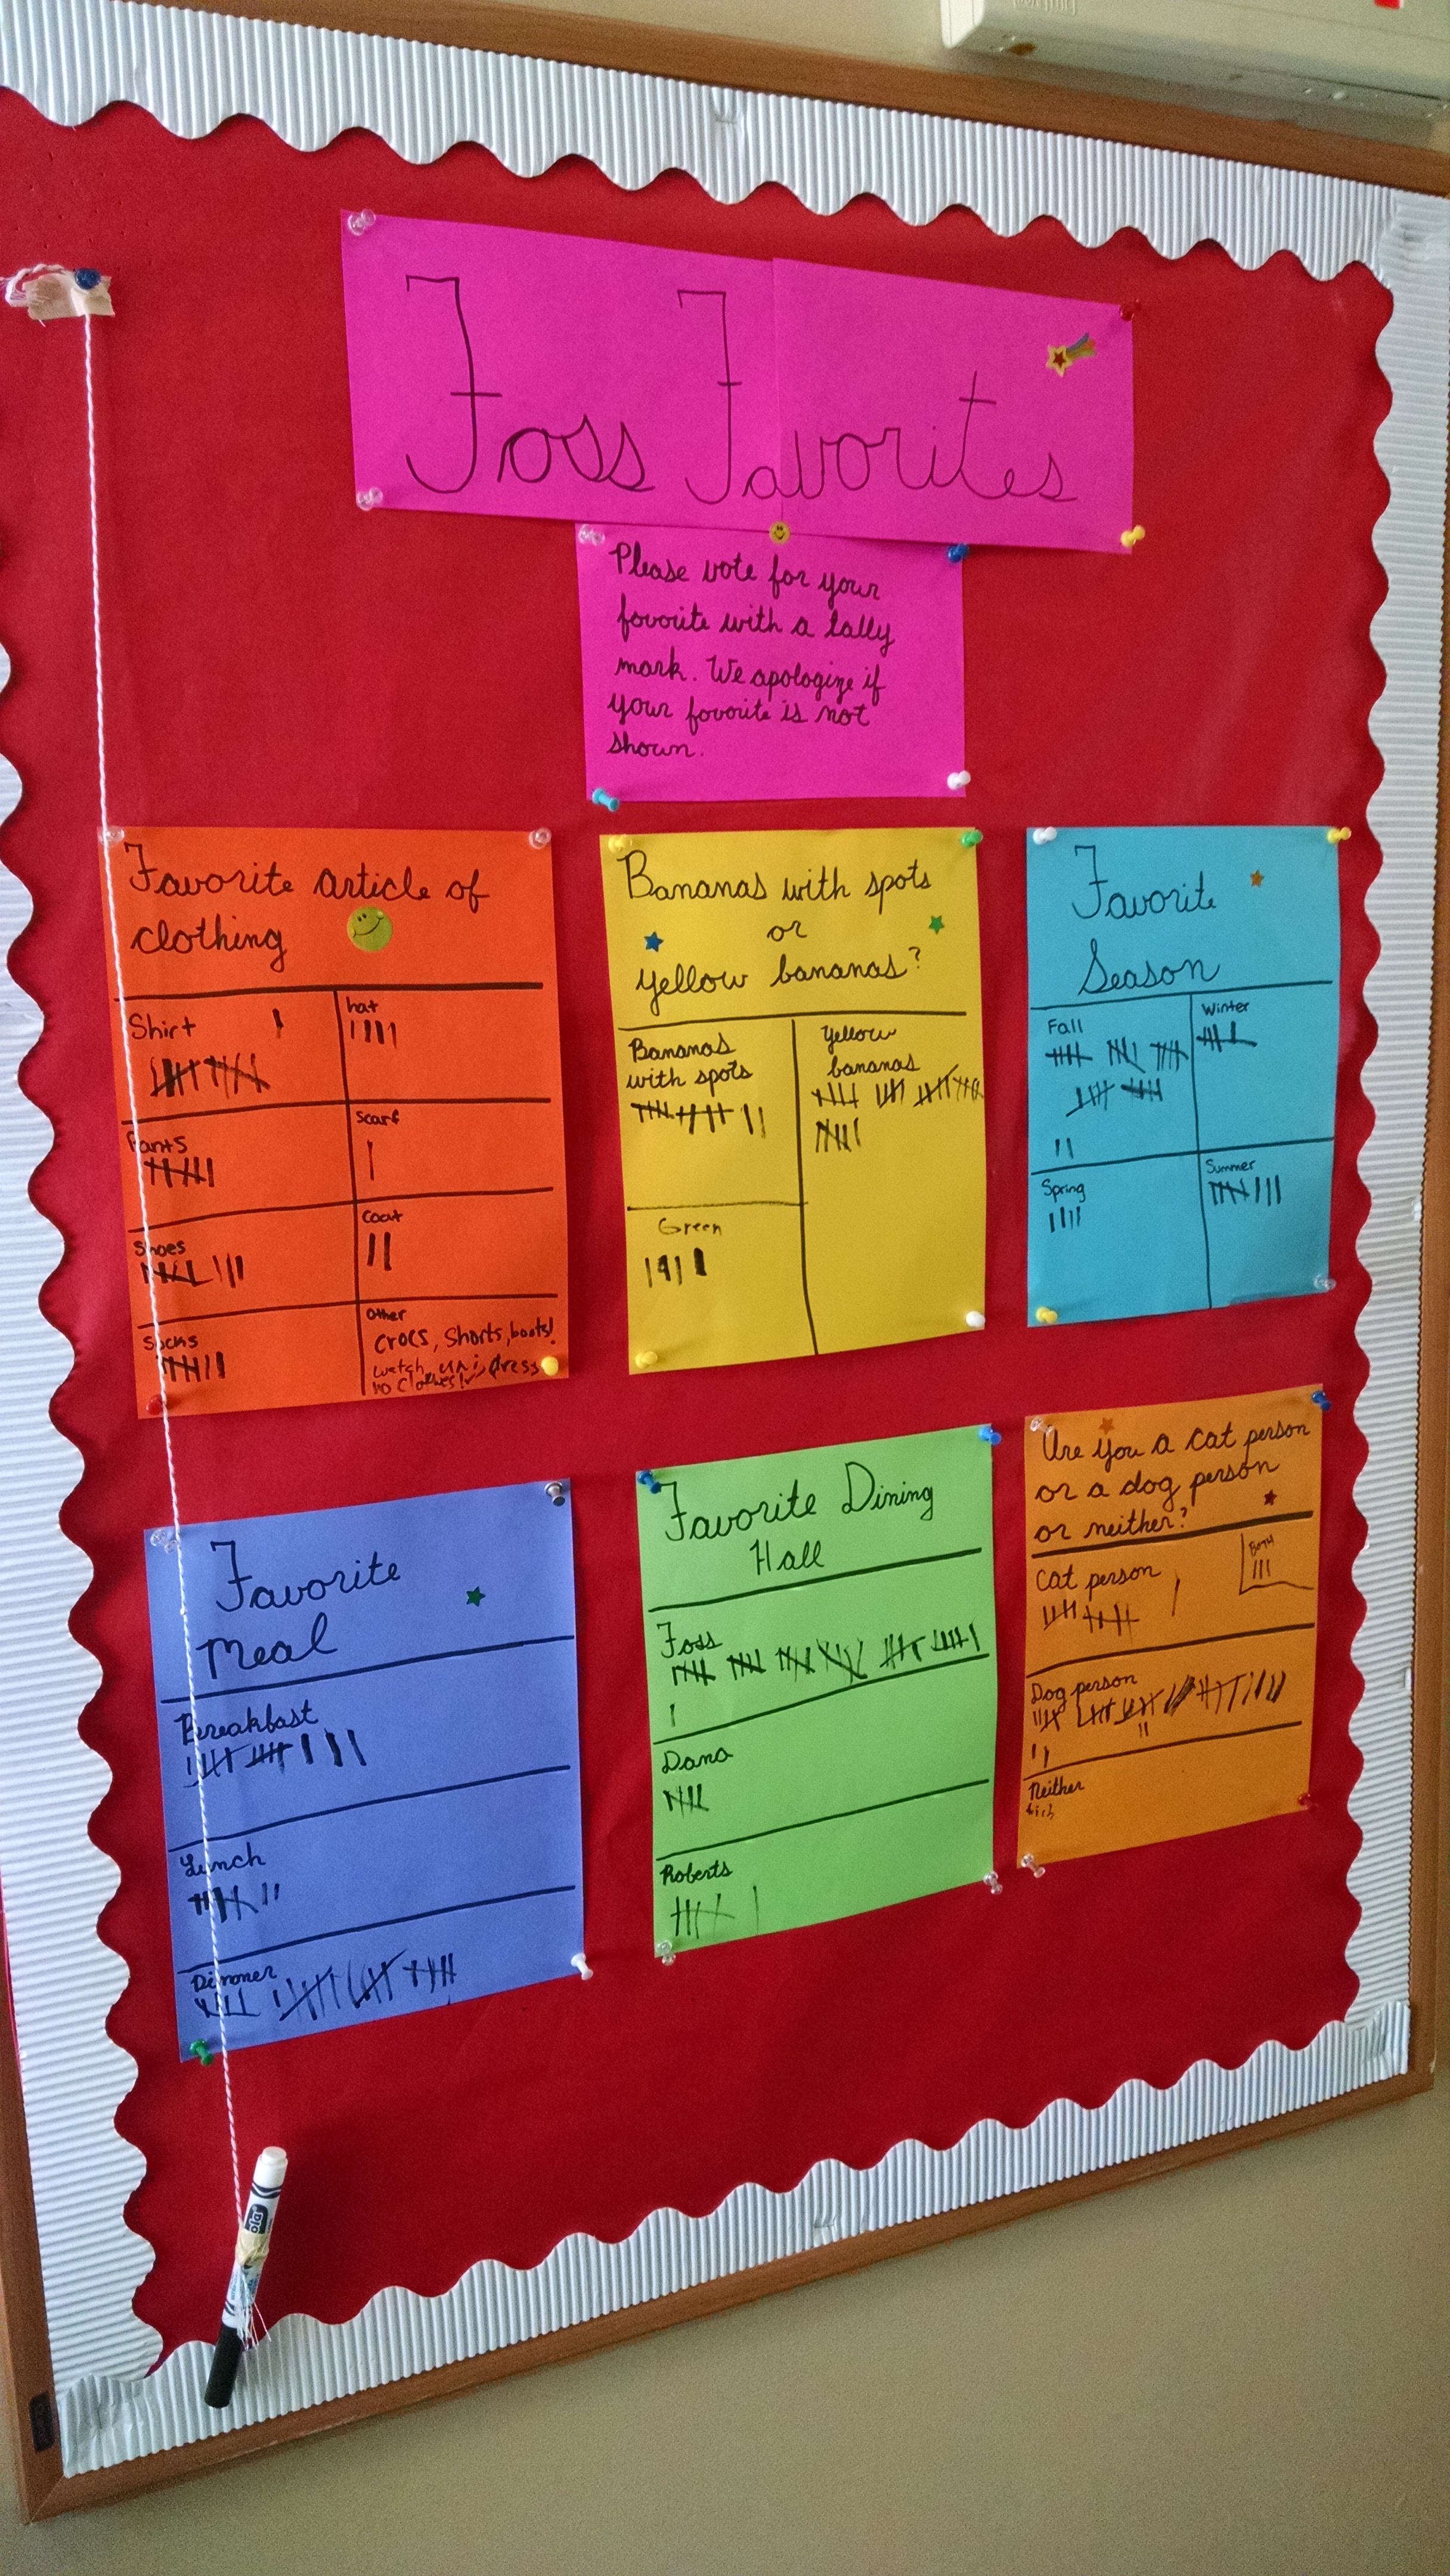
Here at Colby College, students have a choice of three dining halls: Foss, Roberts (affectionately called Bobs), and Dana. Around the start of the year, I saw this informal “survey” near the entrance to Foss:
Students walking past the bulletin board were encouraged to make a tally mark near their favorite season, favorite article of clothing, etc… and their favorite dining hall. Here, Foss is far in the lead, with 32 votes compared to 5 and 6 for Dana and Roberts respectively. But of course, since this bulletin board is at Foss, you only get passers-by who are willing to go to Foss. We talked about this in class as an example of (highly!) biased sampling.
Now, I want to go further, using one of Meng’s effective sample size estimates. Let’s say that we want to estimate the proportion of Colby students whose favorite dining hall is Foss. Meng’s equation (4.4) estimates the effective sample size as
n_eff = 4 * (n/N)^2 * (1/delta)^2
where delta is the expected difference in [probability of responding for people who prefer Foss] versus [probability of responding for people who prefer another dining hall]. The bulletin board showed about n = 43 respondents, which is roughly 1/40th of the 2000-ish student body, so let’s assume n/N = 1/40. In that case, if delta is any larger than 0.05, n_eff is estimated to be 1.
It certainly seems reasonable to believe that Prob(respond to a survey in Foss | you prefer Foss) is at least 5 percentage points higher than Prob(respond to a survey in Foss | you prefer some other dining hall). Foss is near the edge of campus, close to dorms but not classrooms. If you *don’t* prefer the food at Foss, there’s little reason to pass by the bulletin board, much less to leave a tally mark. In other words, delta = 0.05 seems reasonable… which implies that n_eff <= 1 is reasonable… which means this “survey” is about as good as asking ONE random respondent about their favorite dining hall!
[Edit: for a sanity check on delta’s order of magnitude, imagine that in fact about 1/3 of Colby’s students prefer each of the 3 dining halls. So we got around 30/600ish Foss-preferrers responding here, for around a 0.05 response rate. And we got around 12/1200ish of the other students responding here, for around a 0.01 response rate. So the difference in response rates is 0.04. That’s a bit lower than our extreme hypothesized delta = 0.05, but it is in a reasonable ballpark.]
In general, if delta is around twice n/N, we estimate n_eff = 1. Even if we waited to get a much larger sample, say 200 or 250 students leaving tally marks on the board, the survey is still useless if we believe delta >= 0.01 is plausible (which I do).
There’s plenty more of interest in Meng’s article, but this one takeaway is already enough to be fascinating for me—and a nifty in-class example for just *how* bad convenience sampling can be.
It’s been a very busy year since my last post! Job search, new baby, new course to teach, thesis defense, moving… and finally—starting a new position as Assistant Professor, in the Department of Mathematics and Statistics at Colby College. I am delighted and honored to be here. More on all that later, but for now, just a quick announcement:
We are hiring another tenure track faculty member in Statistics here at Colby: https://www.mathjobs.org/jobs/jobs/12378
Please share the posting with anyone who may be interested. This would be the fourth statistician in our Department of Mathematics and Statistics. I am excited that we are expanding our statistics offerings, including our collaboration with the Computer Science department on a minor in Data Science.
Colby College is one of the top small liberal arts colleges in New England. I have found it to be a very collegial, supportive environment, with wonderful students and top-notch colleagues. While Colby emphasizes excellence in teaching, I am already pleased to see that there’s also ample time and resources for research and scholarship as well as professional development.
There is a lot of great energy around Colby’s growing civic engagement with our town of Waterville, as well as increasing size and diversity of both the student body and the faculty. We’re about an hour’s drive from Portland, Maine and about three hours from Boston. The Waterville area offers plenty of local nature and outdoors activities (including a beautiful set of city-maintained cross-country skiing trails).
Full consideration will be given to applications received by October 9, but review will continue until the position is filled. If you have concerns about making this deadline, or if you have any other questions, please do get in touch.
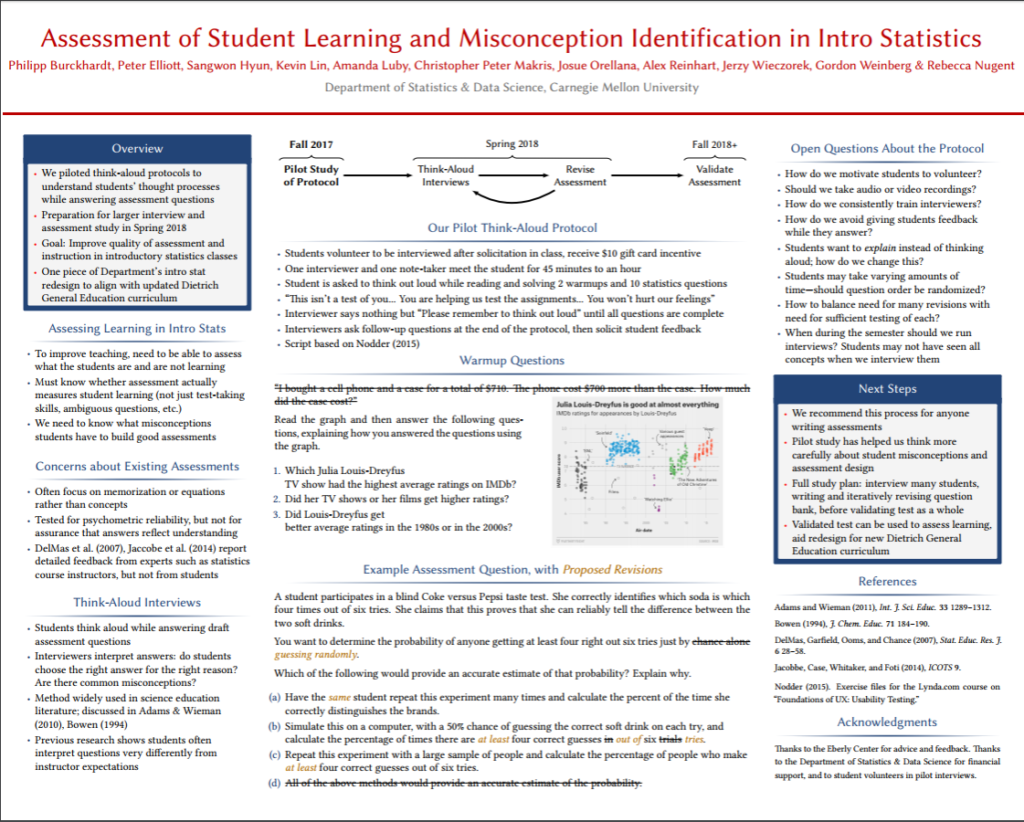
I’m delighted to share with you a pilot study that we ran at CMU this fall, through our Teaching Statistics group. Long story short: It’s hard to write good conceptual-level questions to test student understanding, but think-aloud interviews are a very promising tool. By asking real students to talk out loud as they solve problems, you get insight into whether students give the right/wrong answers because they really do/don’t understand the problem—or whether the question should be better written. If students answer wrong because the question is ambiguous, or if they get it right using generic test-taking strategies rather than knowledge from the course, think-alouds give you a chance to detect this and revise your test questions.
Some context:
CMU’s stats department—renamed the Department of Statistics & Data Science just this fall—is revising the traditional Introductory Statistics classes we offer. Of course, as good statisticians, we’d like to gather evidence and measure whether students are learning any better in the new curriculum. We found several pre-made standardized tests of student learning in college-level Intro Stats, but none of them quite fit what we wanted to measure: have students learned the core concepts, even if they haven’t memorized traditional formulas and jargon?
We tried writing a few such multiple-choice questions ourselves, but it was quite a challenge to see past our own expert blind spots. So, we decided to get hands-on practice with assessment in the Fall 2017 offering of our graduate course on Teaching Statistics. We read Adams and Wieman (2011), “Development and Validation of Instruments to Measure Learning of Expert-Like Thinking”—who recommended using think-aloud interviews as a core part of the test-question design and validation process. This method isn’t commonly known in Statistics, although I have related experience from a decade ago when I studied design at Olin College and then worked in consumer insights research for Ziba Design. It’s been such a delight to revisit those skills and mindsets in a new context here.
We decided to run a pilot study where everyone could get practice running think-aloud interviews. With a handful of anonymous student volunteers, we ran through the process: welcome the volunteer, describe the process, give them some warm-up questions to practice thinking aloud as you solve problems, then run through a handful of “real” Intro Stats test questions and see how they tackle them. During the first pass, the interviewer should stay silent, apart from reminders like “Please remember to think out loud” if the student stops speaking. It’s not perfect, but it gets us closer to how students would really approach this question on an in-class test (not at office hours or in a study session). At the end, we would do a second pass to follow up on anything interesting or unclear, though it’s still best to let them do most of the talking: interviewers might say “I see you answered B here. Can you explain in more detail?” rather than “This is wrong; it should be C because…”
After this pilot, we feel quite confident that a formal think-aloud study will help us write questions that really measure the concepts and (mis)understandings we want to detect. The think-aloud script was drafted based on materials from Chris Nodder’s Lynda.com course and advice from Bowen (1994), “Think-aloud methods in chemistry education”. But there are quite a few open questions remaining about how best to implement the study. We list these on the poster above, which we presented last week at CMU’s Teaching & Learning Summit.
The current plan is to revise our protocol for the rest of Fall 2017 and design a complete formal study. Next, we will run think-alouds and revise individual questions throughout Spring 2018, then pilot and validate at the test level (which set of questions works well as a whole?) in Fall 2018, with pre- and post-tests across several sections and variations of Intro Stats.
PS — I mean no disrespect towards existing Intro Stats assessments such as CAOS, ARTIST, GOALS, SCI, or LOCUS. These have all been reviewed thoroughly by expert statisticians and educators. However, in the documentation for how these tests were developed, I cannot find any mention of think-alouds or similar testing with real students. Student testing seems limited to psychometric validation (for reliability etc.) after all the questions were written. I think there is considerable value in testing question-prototypes with students early in the development process.
PPS — Apologies for the long lack of updates. It’s been a busy year of research and paper-writing, with a particularly busy fall of job applications and interviews. But I’ll have a few more projects ready for sharing here over the next month or two.
Continuing from a while ago: in May I joined an Eberly Center reading group on the educational approach known as Active Learning (AL). Again, AL essentially just means replacing “passive” student behavior (sitting quietly in traditional lectures) with almost anything more “active.”
I’ve already described the first week, where we discussed the meaning of AL and evidence for its effectiveness. In the later two weeks, we explored how to implement a few specific AL styles.
My notes below go pretty far into the weeds, but some big-picture points: Spend more time on designing good questions & tasks (and perhaps less on your lecture notes). Ask students to put a stake in the ground (whether a carefully-prepared response or just a gut-instinct guess) before any time you lead a discussion, show a demo, or give a lecture. Teamwork (done well) has huge benefits, but make sure the assignments are designed to be done in teams (not stapling together individuals’ separate work), and teach teamwork as an explicit skill.
[OK, so last time I joked we should teach a course called Active Active Learning Learning, where we use AL pedagogy to learn about the stats/ML experimental design concept also called Active Learning. But the reverse would be fun too: Run a course on Design of Experiments, where all the experiments are about evaluating the effects of different AL-pedagogy techniques. That is to say, a good course project for Intro Stats or Design of Experiments could be to evaluate the study designs below and improve or extend them.]
I was lucky to have research grant support and minimal TAing duties this fall, so all semester I’ve felt my research was chugging along productively. Yet I have less to show for it than last semester—I went a little too far down an unrewarding rabbit-hole. Knowing when to cut your losses is an important skill to learn!
Previous posts: the 1st, 2nd, 3rd, 4th, 5th, and 6th semesters of my Statistics PhD program.
Research
Having defended my proposal this summer, I spent a lot of time this fall attacking one main sub-problem. Though I always felt I was making reasonable progress, eventually I discovered it to be a dead-end with no practical solution. I had wondered why nobody’s solved this problem yet; it turns out that it’s just inherently difficult, even for the simplest linear-regression case! Basically I wanted to provide finite-sample advice for a method where (1) the commonly-used approach is far from optimal but (2) the asymptotically-optimal approach is useless in finite samples. I think we can salvage parts of my work and still publish something useful, but it’ll be much less satisfying than I had hoped.
Working on a different problem, it felt encouraging to find errors in another statistician’s relevant proof: I felt like a legitimate statistician who can help colleagues notice problems and suggest improvements. On the other hand, it was also disappointing, because I had hoped to apply the proof idea directly to my own problem, and now I cannot 🙂
On a third front, my advisor invited another graduate student, Daren Wang, to help us wrap up a research project I had started in 2015 and then abandoned. Daren is bright, fast, and friendly, a pleasure to collaborate with (except when I’m despairing that it only took him a week to whiz through and improve on the stuff that took me half a year). Quite quickly, we agreed there’s no more to be done to make this project a much-better paper—so let’s just package it up now and submit to a conference. It was satisfying to work on writing and submitting a paper, one of the main skills for which I came to grad school!
Finally, I was hoping to clear up some stumbling blocks in an end-of-semester meeting with several committee members. Instead, our meeting raised many fascinating new questions & possible future directions… without wrapping up any loose ends. Alas, such is research 🙂
Classes
As I’ve noted before, I audited Jordan Rodu’s Deep Learning course. I really liked the journal-club format: Read a paper or two for every class session. Write a short response before class, so the instructor can read them first. Come prepared to discuss and bring up questions of your own. I wish more of our courses were like this—compared to lecture, it seems better for the students and less laborious for the instructor.
Although it was a theory course, not hands-on, I did become intrigued enough by one of the papers to try out the ideas myself. Together with classmate Nicolas Kim, we’re playing around with Keras on a GPU to understand some counterintuitive ideas a little better. Hopefully we’ll have something to report in a couple of weeks.
I also started to audit Kevin Kelly’s undergrad and grad-level courses on Epistemology (theory of knowing). Both were so fascinating that I had to drop them, else I would have done all the course readings at the expense of my own research 🙂 but I hope to take another stab someday. One possibly-helpful perspective I got, from my brief exposure to Epistemology, was a new-to-me (caricatured) difference between Bayesian and classical statistics.
Apparently most philosophy-of-science epistemologists are Bayesian. They posit that a scientist’s work goes like this: You are given a hypothesis, some data, and some prior knowledge or belief about the problem. How should we use the data to update our knowledge/belief about that hypothesis? In that case, obviously, Bayesian updating is a sensible way to go.
But I disagree with the premise. Often, a scientist’s work is more like this: You’re not handed a hypothesis or a dataset, but must choose them yourself. You also know your colleagues will bicker over claims of prior knowledge. If you come up with an interesting question, what data should you collect so that you’ll most likely find a strong answer? That is, an answer that most colleagues will find convincing regardless of prior belief, and that will keep you from fooling yourself? This is the classical / frequentist setting, which treats design (of a powerful, convincing experiment / survey / study) as the heart of statistics. In other words, you’re not merely evaluating “found” data—your task is to choose a design in hopes of making a convincing argument.
Other projects
Some of my cohort-mates and I finally organized a Dissertation Writing Group, a formal setting to talk shop technically with other students whose advisors don’t already hold research-group meetings. I instigated this selfishly, wanting to have other people I can pester with theory questions or simply vent with. But my fellow students agreed it’s been useful to them too. We’re also grateful to our student government for funding coffee and snacks for these meetings.
I did not take on other new side projects this fall, but I’ve stayed in touch with former colleagues from the Census Bureau still working on assessing & visualizing uncertainty in estimate rankings. We have a couple of olderreports about these ideas. We still hope to publish a revised version, and we’re working on a website to present some of the ideas interactively. Eventually, the hope is to incorporate some of this into the Census website, to help statistical-novice data users understand that estimates and rankings come with statistical uncertainty.
Finally, I heard about (but have not attended) CMU’s Web Dev Weekend. I really like the format: a grab-bag of 1- or 2-hour courses, suitable for novices, that get you up and running with a concrete project and a practical skill you can take away. Can we do something similar for statistics?
Topic ideas where a novice could learn something both interesting and
useful in a 1.5h talk:
How not to fool yourself in A/B testing (basic experimental design and power analysis)
Befriend your dataset (basic graphical and numerical EDA, univariate and bivariate summaries, checking for errors and outliers)
Plus or minus a bit (estimating margins of error—canned methods for a few simple problems, intro to bootstrap for others)
Black box white belt (intro to some common data mining methods you might use as baselines in Kaggle-like prediction problems)
Many of these could be done with tools that are familiar (Excel) or novice-friendly (Tableau), instead of teaching novices to code in R at the same time as they learn statistical concepts. This would be a fun project for a spring weekend, in my copious spare time (hah!)
Life
Offline, we are starting to make some parent friends through daycare and playgrounds. I’m getting a new perspective on why parents tend to hang out with other parents: it’s nice to be around another person who really understands the rhythm of conversation when your brain is at best a quarter-present (half-occupied by watching kid, quarter-dysfunctional from lack of sleep). On the other hand, it’s sad to see some of these new friends moving away already, leaving the travails of academia behind for industry (with its own new & different travails but a higher salary).
So… I made the mistake of looking up average salaries myself. In statistics departments, average starting salaries for teaching faculty are well below starting salaries for research faculty. In turn, research faculty’s final salary (after decades of tenure) is barely up to the starting salaries I found for industry Data Scientists. Careers are certainly not all about the money, but the discrepancies were eye-opening, and they are good to know about in terms of financial planning going forward. (Of course, those are just averages, with all kinds of flaws. Particularly notable is the lack of cost-of-living adjustment, if a typical Data Scientist is hired in expensive San Francisco while typical teaching faculty are not.)
But let’s end on a high note. Responding to a question about which R / data science blogs to follow, Hadley Wickham cited this blog! If a Hadley citation can’t go on a statistician’s CV, I don’t know what can 🙂
Next up
The 8th, 9th, and 10th semesters of my Statistics PhD program.