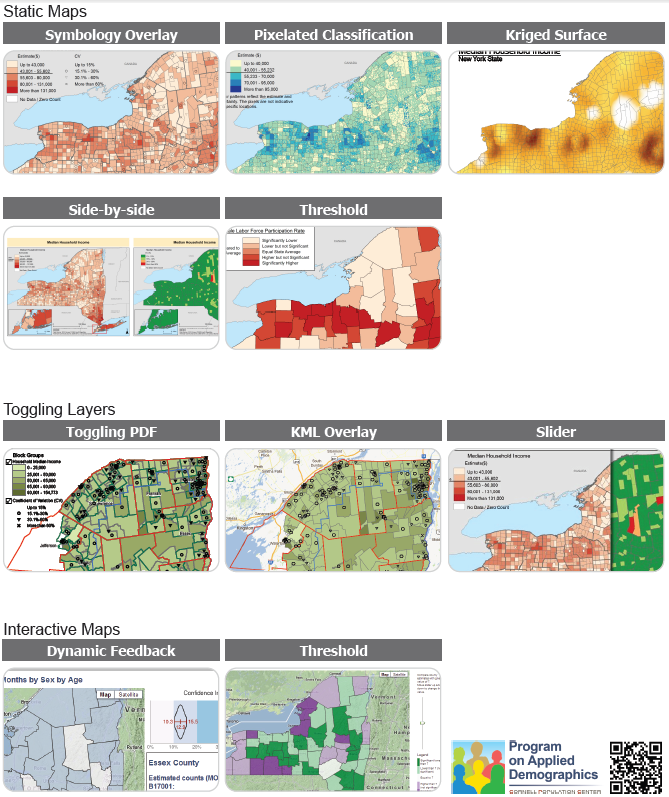
A few years ago, a team at the Cornell Program on Applied Demographics (PAD) created a really nice demo of several ways to show statistical uncertainty on thematic maps / choropleths. They have kindly allowed me to host their large file here: PAD_MappingExample.pdf (63 MB)

Each of these maps shows a dataset with statistical estimates and their precision/uncertainty for various areas in New York state. If we use color or shading to show the estimates, like in a traditional choropleth map, how can we also show the uncertainty at the same time? The PAD examples include several variations of static maps, interaction by toggling overlays, and interaction with mouseover and sliders. Interactive map screenshots are linked to live demos on the PAD website.
I’m still fascinated by this problem. Each of these approaches has its strengths and weaknesses: Symbology Overlay uses separable dimensions, but there’s no natural order to the symbols. Pixelated Classification seems intuitively clear, but may be misleading if people (incorrectly) try to find meaning in the locations of pixels within an area. Side-by-side maps are each clear on their own, but it’s hard to see both variables at once. Dynamic Feedback gives detailed info about precision, but only for one area at a time, not all at once. And so forth. It’s an interesting challenge, and I find it really helpful to see so many potential solutions collected in one document.
The creators include Nij Tontisirin and Sutee Anantsuksomsri (both since moved on from Cornell), and Jan Vink and Joe Francis (both still there). The pixellated classification map is based on work by Nicholas Nagle.
For more about mapping uncertainty, see their paper:
Francis, J., Tontisirin, N., Anantsuksomsri, S., Vink, J., & Zhong, V. (2015). Alternative strategies for mapping ACS estimates and error of estimation. In Hoque, N. and Potter, L. B. (Eds.), Emerging Techniques in Applied Demography (pp. 247–273). Dordrecht: Springer Netherlands, DOI: 10.1007/978-94-017-8990-5_16 [preprint]
and my related posts:
- Localized Comparisons: my own attempts at showing uncertainty in an interactive map and in a cartogram, plus links to work by Gabriel Florit, David Sparks, Nicholas Nagle, and Nancy Torrieri & David Wong
- Nice example of a map with uncertainty: a map by Michael Wininger
See also Visualizing Attribute Uncertainty in the ACS: An Empirical Study of Decision-Making with Urban Planners. This talk by Amy Griffin is about studying how urban planners actually use statistical uncertainty on maps in their work.

Thanks for sharing this. I was happy to see Cornell include the pixellated classification, which was my baby but the name is all theirs. I still think that there are ways to do it that minimize the problem you mention of people interpret it as an interpolation. They need to be user tested though.
Ah, sorry, I forgot the pixellated one was your idea. The PDF doesn’t seem to cite individual authors.
If you ever get it user tested, let me know. Is that in the works as part of your project with Amy and Seth?
For completeness, let me also post my animated version of the pixellated classification concept. There’s a Play button at the bottom (doesn’t seem to work in Chrome, but works for me in Adobe Reader).
Tommy Wright suggested using moving noise, like TV static, so we threw this together for fun. This is completely untested, based on random data, and may possibly induce epilepsy 🙂