Roulette Wheel of Time

While we’re on crossovers between statistics and brick-sized fantasy novels, I remember taking some notes on references to math, logic, and probability in Robert Jordan’s Wheel of Time book series.

(I really can’t recommend the series. I enjoyed the first few books in middle school, but in a re-read last year they haven’t stood up to my childhood memories. The first is still fun but a blatant Tolkien ripoff; the rest are plodding and repetitive.)

Readers, can you recommend any good fantasy / sci-fi (or other fiction) that treats stats & math well?

The Dragon Reborn

A few of the characters discuss the difference between distributions that show clustering, uniformity, and randomness:

“It tells us it is all too neat,” Elayne said calmly. “What chance that thirteen women chosen solely because they were Darkfriends would be so neatly arrayed across age, across nations, across Ajahs? Shouldn’t there be perhaps three Reds, or four born in Cairhien, or just two the same age, if it was all chance? They had women to choose from or they could not have chosen so random a pattern. There are still Black Ajah in the Tower, or elsewhere we don’t know about. It must mean that.”

She’s suspicious of the very uniform distribution of demographic characteristics in the observed sample of 13 bad-guy characters. If turning evil happens at random, or at least is independent of these demographics, you’d expect some clusters to occur by chance in such a small sample—that’s why statistical theory exists, to help decide if apparent patterns are spurious. And if evil was associated with any demographic, you’d certainly expect to see some clusters. The complete absence of clustering (in fact, we see the opposite: dispersion) looks more like an experimental design, selecting observations that are as different as possible… implying there is a larger population to choose from than just these 13. Nice 😛

There are also records of historical hypothesis testing of a magical artifact:

“Use unknown, save that channeling through it seems to suspend chance in some way, or twist it.” She began to read aloud. “‘Tossed coins presented the same face every time, and in one test landed balanced on edge one hundred times in a row. One thousand tosses of the dice produced five crowns one thousand times.'”

That’s a degenerate distribution right there.

Mat, the lucky-gambler character, also talks of luck going in his favor more often where there’s more randomness: he always wins at dice, usually at card games, and rarely at games like “stones” (basically Go). It’d be good fodder for a short story set in our own world—a character who realizes he’s no braniac but incredibly lucky and so seeks out luck-based situations. What else could you do, besides the obvious lottery tickets and casinos?

The Shadow Rising

I was impressed by Elayne’s budding ability to think like a statistician in the previous book, but she returns to more simplistic thinking in this book. The characters ponder murder motives (p.157):

“They were killed because they talked […] Or to stop them from it […] They might have been killed simply to punish them for being captured […] Three possibilities, and only one says the Black Ajah knows they revealed a word. Since all three are equal, the chances are that they do not know.”

Oh, Elayne. There are well-known problems with the principle of insufficient reason. Your approach to logic may get you into trouble yet.

Lord of Chaos

The description of Caemlyn’s chief clerk and census-taker Halwin Norry is hamfisted and a missed opportunity:

Rand … was not certain anything was real to Norry except the numbers in his ledgers. He recited the number of deaths during the week and the price of turnips carted in from the countryside in the same dusty tone, arranged the daily burials of penniless friendless refugees with no more horror and no more joy than he showed hiring masons to check the repair of the city walls. Illian was just another land to him, not the abode of Sammael, and Rand just another ruler.

If anything, Norry sounds like an admirable professional! Official statisticians must be as objective and politically disinterested as possible; else the rulers can make whatever “decisions” they like but there’ll be no way to accurately carry them out when you don’t know what resources you actually have on hand nor how severe the problem really is. It’d be fascinating to see how Norry actually gets runs a war-time census—perhaps with scrying help from the local magic users? But here Jordan is just sneering down. Such a shame.

Knife of Dreams

There are a few ridiculous scenes of White Ajah logicians arguing; I should have noted them down. I’m not sure if Jordan really believes mathematicians and logicians talk like this, or whether his tongue is in cheek and he’s just joking, but man, it’s a grotesque caricature. Someday I’d love to see a popular book describe the kind of arguments mathematicians actually have with each other. But this isn’t it.

Reader Morghulis

TL;DR: Memento mori. After reading too much Seneca, I’m meditating on death like a statistician, by counting how many of GRRM’s readers did not even survive to see the HBO show (much less the end of the book series). Rough answer: around 40,000.
No disrespect meant to Martin, his readers, or their families—it’s just a thought exercise that intrigued me, and I figured it may interest other people.
Also, we’ve blogged about GoT and statistics before.

In the Spring a young man’s fancy lightly turns to actuarial tables.

That’s right: Spring is the time of year when the next bloody season of Game of Thrones airs. This means the internet is awash with death counts from the show and survival predictions for the characters still alive.

All the deaths in 'A Song of Ice and Fire'

Others, more pessimistically, wonder about the health of George R. R. Martin, author of the A Song of Ice and Fire (ASOIAF) book series (on which Game of Thrones is based). Some worried readers compare Martin to Robert Jordan, who passed away after writing the 11th Wheel of Time book, leaving 3 more books to be finished posthumously. Martin’s trilogy has become 5 books so far and is supposed to end at 7, unless it’s 8… so who really knows how long it’ll take.

(Understandably, Martin responds emphatically to these concerns. And after all, Martin and Jordan are completely different aging white American men who love beards and hats and are known for writing phone-book-sized fantasy novels that started out as intended trilogies but got out of hand. So, basically no similarities whatsoever.)

But besides the author and his characters, there’s another set of deaths to consider. The books will get finished eventually. But how many readers will have passed away waiting for that ending? Let’s take a look.

Caveat: the inputs are uncertain, the process is handwavy, and the outputs are certainly wrong. This is all purely for fun (depressing as it may be).

Dilbert_AvgMultiplyData

Continue reading “Reader Morghulis”

Small Area Estimation 101: old materials posted

I never got around to polishing my Small Area Estimation (SAE) “101” tutorial materials that I promised a while ago. So here they are, though still unedited and not as clean / self-explanatory as I’d like.

The slides introduce a few variants of the simplest area-level (Fay-Herriot) model, analyzing the same dataset in a few different ways. The slides also explain some basic concepts behind Bayesian inference and MCMC, since the target audience wasn’t expected to be familiar with these topics.

  • Part 1: the basic Frequentist area-level model; how to estimate it; model checking (pdf)
  • Part 2: overview of Bayes and MCMC; model checking; how to estimate the basic Bayesian area-level model (pdf)
  • All slides, data, and code (ZIP)

The code for all the Frequentist analyses is in SAS. There’s R code too, but only for a WinBUGS example of a Bayesian analysis (also repeated in SAS). One day I’ll redo the whole thing in R, but it’s not at the top of the list right now.

Frequentist examples:

  • “ByHand” where we compute the Prasad-Rao estimator of the model error variance (just for illustrative purposes since all the steps are explicit and simpler to follow; but not something I’d usually recommend in practice)
  • “ProcMixed” where we use mixed modeling to estimate the model error variance at the same time as everything else (a better way to go in practice; but the details get swept up under the hood)

Bayesian examples:

  • “ProcMCMC” and “ProcMCMC_alt” where we use SAS to fit essentially the same model parameterized in a few different ways, some of whose chains converge better than others
  • “R_WinBUGS” where we do the same but using R to call WinBUGS instead of using SAS

The example data comes from Mukhopadhyay and McDowell, “Small Area Estimation for Survey Data Analysis using SAS Software” [pdf].

If you get the code to run, I’d appreciate hearing that it still works 🙂

My SAE resources page still includes a broader set of tutorials/textbooks/examples.

Forget NHST: conference bans all conclusions

Once again, CMU is hosting the illustrious notorious SIGBOVIK conference.

Not to be outdone by the journal editors who banned confidence intervals, the SIGBOVIK 2015 proceedings (p.83) feature a proposal to ban future papers from reporting any conclusions whatsoever:

In other words, from this point forward, BASP papers will only be allowed to include results that “kind of look significant”, but haven’t been vetted by any statistical processes…

This is a bold stance, and I think we, as ACH members, would be remiss if we were to take a stance any less bold. Which is why I propose that SIGBOVIK – from this day forward – should ban conclusions

Of course, even this provision may not be sufficient, since readers may draw their own conclusions from any suggestions, statements, or data presented by authors. Thus, I suggest a phased plan to remove any potential of readers being mislead…

I applaud the author’s courageous leadership. Readers of my own SIGBOVIK 2014 paper on BS inference (with Alex Reinhart) will immediately see the natural synergy between conclusion-free analyses and our own BS.

Statistics Done Wrong, Alex Reinhart

Hats off to my classmate Alex Reinhart for publishing his first book! Statistics Done Wrong: The Woefully Complete Guide [website, publisher, Amazon] came out this month. It’s a well-written, funny, and useful guide to the most common problems in statistical practice today.

Although most of his examples are geared towards experimental science, most of it is just as valid for readers working in social science, data journalism [if Alberto Cairo likes your book it must be good!], conducting surveys or polls, business analytics, or any other “data science” situation where you’re using a data sample to learn something about the broader world.

This is NOT a how-to book about plugging numbers into the formulas for t-tests and confidence intervals. Rather, the focus is on interpreting these seemingly-arcane statistical results correctly; and on designing your data collection process (experiment, survey, etc.) well in the first place, so that your data analysis will be as straightforward as possible. For example, he really brings home points like these:

  • Before you even collect any data, if your planned sample size is too small, you simply can’t expect to learn anything from your study. “The power will be too low,” i.e. the estimates will be too imprecise to be useful.
  • For each analysis you do, it’s important to understand commonly-misinterpreted statistical concepts such as p-values, confidence intervals, etc.; else you’re going to mislead yourself about what you can learn from the data.
  • If you run a ton of analyses overall and only publish the ones that came out significant, such data-fishing will mostly produce effects that just happened (by chance, in your particular sample) to look bigger than they really are… so you’re fooling yourself and your readers if you don’t account for this problem, leading to bad science and possibly harmful conclusions.

Admittedly, Alex’s physicist background shows in a few spots, when he implies that physicists do everything better 🙂 (e.g. see my notes below on p.49, p.93, and p.122.)
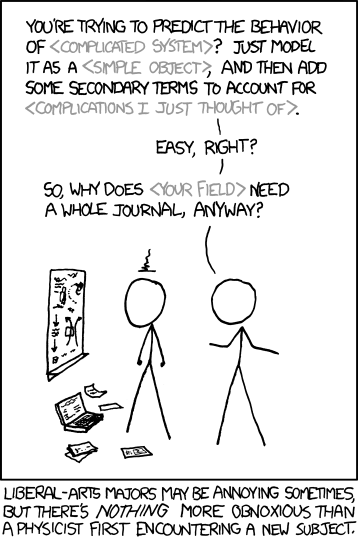
XKCD: Physicists
Seriously though, the advice is good. You can find the correct formulas in any Stats 101 textbook. But Alex’s book is a concise reminder of how to plan a study and to understand the numbers you’re running, full of humor and meaningful, lively case studies.

Highlights and notes-to-self below the break:
Continue reading Statistics Done Wrong, Alex Reinhart”

NHST ban followup

I’ve been chatting with classmates about that journal that banned Null Hypothesis Significance Testing (NHST). Some have more charitable interpretations than I did, and I thought they’re worth sharing.

Similarly, a writeup on Nature’s website quoted a psychologist who sees two possibilities here:

“A pessimistic prediction is that it will become a dumping ground for results that people couldn’t publish elsewhere,” he says. “An optimistic prediction is that it might become an outlet for good, descriptive research that was undervalued under the traditional criteria.”

(Also—how does Nature, of all places, get the definition of p-value wrong? “The closer to zero the P value gets, the greater the chance the null hypothesis is false…” Argh. But that’s neither here nor there.)

Here’s our discussion, with Yotam Hechtlinger and Alex Reinhart.

Continue reading “NHST ban followup”

Very gentle resource for speeding up R code

Nathan Uyttendaele has written a great beginner’s guide to speeding up your R code. Abstract:

Most calculations performed by the average R user are unremarkable in the sense that nowadays, any computer can crush the related code in a matter of seconds. But more and more often, heavy calculations are also performed using R, something especially true in some fields such as statistics. The user then faces total execution times of his codes that are hard to work with: hours, days, even weeks. In this paper, how to reduce the total execution time of various codes will be shown and typical bottlenecks will be discussed. As a last resort, how to run your code on a cluster of computers (most workplaces have one) in order to make use of a larger processing power than the one available on an average computer will also be discussed through two examples.

Unlike many similar guides I’ve seen, this really is aimed at a computing novice. You don’t need to be a master of the command line or a Linux expert (Windows and Mac are addressed too). You are walked through installation of helpful non-R software. There’s even a nice summary of how hardware (hard drives vs RAM vs CPU) all interact to affect your code’s speed. The whole thing is 60 pages, but it’s a quick read, and even just skimming it will probably benefit you.

Favorite parts:

  • “The strategy of opening R several times and of breaking down the calculations across these different R instances in order to use more than one core at the same time will also be explored (this strategy is very effective!)” I’d never realized this is possible. He gives some nice advice on how to do it with a small number of R instances (sort of “by hand,” but semi-automated).
  • I knew about rm(myLargeObject), but not about needing to run gc() afterwards.
  • I haven’t used Rprof before, but now I will.
  • There’s helpful advice on how to get started combining C code with R under Windows—including what to install and how to set up the computer.
  • The doSMP package sounds great — too bad it’s been removed 🙁 but I should practice using the parallel and snow packages.
  • P.63 has a helpful list of questions to ask when you’re ready to learn using your local cluster.

One thing Uyttendaele could have mentioned, but didn’t, is the use of databases and SQL. These can be used to store really big datasets and pass small pieces of them into R efficiently, instead of loading the whole dataset into RAM at once. Anthony Damico recommends the column-store database system MonetDB and has a nice introduction to using MonetDB with survey data in R.

Launch party for CMU undergrad stats major programs

So here at CMU, we’re proud to have one of the “largest and fastest-growing” statistics departments in the US.

Tomorrow (March 3rd) is the launch party for several new (joint-)major programs for CMU undergrads: Statistics and Machine Learning, Statistics and Neuroscience, and Mathematical Statistics. That’s in addition to two existing programs: Statistics Core and the joint program in Economics and Statistics.

If you’re in Pittsburgh, come to the launch party at 4:30pm tomorrow. We’ll have project showcases, advising, interactive demos, etc., not to mention free food 🙂

Journal bans null hypothesis testing and confidence intervals

So I’ve complained before about the problems with Null Hypothesis Significance Testing (NHST) and how, in many cases, it’d be more informative and more useful to report confidence intervals instead of p-values.

Well, the journal Basic and Applied Social Psychology has recently decided to ban p-values… but they’ve also tossed out confidence intervals and all the rest of classical statistical inference. And they’re not sold on Bayesian inference either. (Nor does their description of Bayes convince me that they understand it, with weird wordings like “strong grounds for assuming that the numbers really are there.”)

Apparently, instead of choosing another, less common inference flavor (such as likelihood or fiducial inference), they are doing away with rigorous inference altogether and only publishing descriptive statistics. The only measure they explicitly mention to prevent publishing spurious findings is that “we encourage the use of larger sample sizes than is typical in much psychology research, because as the sample size increases, descriptive statistics become increasingly stable and sampling error is less of a problem.” That sounds to me like they know sampling error and inference are important—they just refuse to quantify them, which strikes me as bizarre.

I’m all in favor of larger-than-typical sample sizes, but I’m really curious how they will decide whether they are large enough. Sample sizes need to be planned before the experiment happens, long before you get feedback from the journal editors. If a researcher plans an experiment, hoping to publish in this journal, what guidance do they have on what sample size they will need? Even just doubling the sample size is already often prohibitively expensive, yet it doesn’t even halve the standard error; will that be convincing enough? Or will they only publish Facebook-sized studies with millions of participants (which often have other experimental-design issues)?

Conceivably, they might work out these details and this might still turn out to be a productive change making for a better journal, if the editors are more knowledgeable than the editorial makes them sound, AND if they do actually impose a stricter standard than p<0.05, AND if good research work meeting this standard is ever submitted to the journal. But I worry that, instead, it'll just end up downgrading the journal's quality and reputation, making referees unsure how to review articles without statistical evidence, and making readers unsure how reliable the published results are. See also the American Statistical Association’s comment on the journal’s new policy, and the reddit discussion (particularly Peter’s response).

Edit: John Kruschke is more hopeful, and Andrew Gelman links to a great paper citing cases of actual harm done by NHST. Again, I’m not trying to defend overuse of p-values—but there are useful and important parts of statistical inference (such as confidence intervals) that cannot be treated rigorously with descriptive statistics alone. And reliance on the interocular trauma test alone just frees up more ways to fiddle with the data to sneak it past reviewers.

After 3rd semester of Statistics PhD program

It’s time for another braindump of reflections on statistics grad school.
See also the previous two posts: After 1st semester of Statistics PhD program and  After 2nd semester of Statistics PhD program.

This was my last semester of required coursework. Having passed the Data Analysis Exam in May, and with all the courses under my belt, I am pretty much ready to focus on the thesis topic search and proposal. Exciting!

Classes: Continue reading “After 3rd semester of Statistics PhD program”