After 2nd semester of Statistics PhD program

Here’s another post on life as a statistics PhD student (in the Department of Statistics, at Carnegie Mellon University, in Pittsburgh, PA).
The previous such post was After 1st semester of Statistics PhD program.

Classes:

  • I feared that Advanced Probability Overview would be just dry esoteric theory, but Jing Lei ensured all the topics were really well-motivated. Although it was tough, I did better than I’d hoped (especially given that I’ve never taken a proper Real Analysis course). In Statistical Machine Learning, Larry Wasserman and Ryan Tibshirani did a great job of balancing “old” core theory with new cutting-edge research topics, including helpful homework assignments that gave us practice both in theory and in applications.
  • My highlight of the semester was being able to read and digest a research paper that was way too abstract when I tried reading it a few years ago. It really hit me that I must be learning something in grad school 🙂
    (The paper was Building Consistent Regression Trees from Complex Sample Data, by Toth and Eltinge. While working at Census, I wanted to try running a complex-survey-weighted regression tree, but I couldn’t get much out of this paper. Now, after a good dose of probability theory and machine learning, it’s far clearer. In fact, I have some ideas about extending this work!)
  • The Statistical Machine Learning class referenced a ton of crazy math terms I wasn’t familiar with: Banach and Hilbert spaces, Lp norms, conjugate functions, etc. It terrified me at first—I’ve never even heard of this stuff, should I have taken grad-level functional analysis before I started this PhD, am I about to fail?!?—but it turns out a lot of it is just names for specific versions of general concepts that I already knew. Whew. Also, most of it got used repeatedly from topic to topic, so we did gain familiarity even without explicitly taking a functional analysis course etc. So, don’t get disheartened too easily by unfamiliar terminology!
  • It was great to finally learn more about Lp norms and about splines. Also, almost everything in SML can be written as a penalized regression 😛
  • Smoothing splines and Reproducing Kernel Hilbert Space (RKHS) regression are nifty because the setup is that you want to optimize over all possible functions. So you start out with an infinite-dimensional space, for which in general there might be no simple way to search/optimize! … But in these specific setups, we can prove that the optimal solution happens to lie in a finite-dimensional subspace, where your usual optimization/search tools will work after all. Nice.
  • Larry had a nice “foundations” day in SML, with examples where Bayes and Frequentist analysis differ greatly. However, I didn’t find most of his examples too convincing, since the Bayesian “loses” only due to a stupid choice of priors; or the Bayesian “loses” for finite n but in a case where n in practice would have to be ridiculously large. Still, this helped stretch my thinking about how these inference philosophies differ.
  • Larry points out: you often hear that “We might as well go Bayes because if you give people a Frequentist interval, they’ll interpret it as a Bayes interval.” But the reverse is also true: Give someone a sequence of 95% Bayes intervals, and they’ll expect 95% of them to contain the true value. That is NOT necessarily going to happen with Bayes CIs (unlike Frequentist CIs).
  • In addition to Subjective, Objective, Empirical, or Calibrated Bayes, let me propose “Cynical Bayes”: Don’t choose a prior because you believe it. Instead, choose one to optimize your estimator’s Frequentist properties. That way you can keep your expert Freq’ist colleagues happy, yet still call it a Bayes estimator, so you can give the usual Bayes interpretation to keep nonexperts happy 🙂
  • A background in Statistics will keep you thinking about distributions and probabilities and convergences. But a background in Applied Math may be better at giving you tools and ideas for feature engineering. It’s worth having both toolsets.
  • The Advanced Probability Overview course covered some measure-theoretic probability. I’m finally understanding the subtleties of how the different convergences \xrightarrow{p}, \xrightarrow{as}, \xrightarrow{D}, and \xrightarrow{L^p} all differ, and why it matters. We saw these concepts last semester in Intermediate Statistics, but the distinctions are far clearer to me now.
  • AdvProb’s measure theory section also really helped me understand why textbooks say a random variable is a “function”: intuitively it seems like just a variable or a number or something… but in fact it really is a function, from “the state of the world” i.e. an element \omega of the set \Omega of all possible outcomes or states of the world, to the measurement you will collect (often a number on the real line). Finally, this measure theory view of probability, as the size of a subset of \Omega, is helpful. Even though statisticians’ goal is to develop tools that let them work with the range of the random variable and ignore the domain \Omega, it’s good to remember that this domain exists.
  • However, measure theory and probability theory suffer from some really poor terminology! For example, it took me far too long to realize that “integrable” means “the integral is finite”, NOT “the integral exists.”
  • When we teach students R, we really should use practical examples, not the arbitrary generic examples that you see so often. Instead of just showing me list(1,"a"), it helps to give a realistic example of why you may actually need to collect together numeric and character elements in a single object.

Research:

  • I started a new research project, the Advanced Data Analysis project, which will run until the end of this upcoming Fall semester (so about a year total). I am working with Rob Kass and Avniel Ghuman on using magnetoencephalography (MEG) data to study epilepsy.
  • At Rob’s research group meetings, I learn a ton from the helpful questions he asks. When presenting someone else’s work (i.e. for a journal club), ask yourself, “What would you do if *your* research was based on the data from this paper?” Still, I’ve found I really do need to keep scheduling weekly 1-on-1 meetings—the group meetings are not enough to stay optimally on track.
  • Neuroscience is hard! Pre-processing massive neuroscience datasets using not-fully-documented open source software is particularly hard. When I chose this project, I did not realize how much time I would have to spent on learning the subject matter, relevant specialized software tools, and data pre-processing workflow. Four months in and I’ve still barely gotten to the point of doing any “real” statistics. It’s a good project and I’m learning a lot, but it’s disheartening to see how much of that learning has been tied to debugging open-source software installations that I’ll only ever use again if I stay in this sub-field.
    I would advise the next PhD cohort to choose projects that’ll primarily teach you more general-purpose, transferable skills. Maybe take an existing theoretical method that’s not implemented in software yet, and make it into an R package?

Life:

  • This was a tougher semester in many ways, with harder classes and more research-related setbacks. The Cake song Tougher than it is got a lot of play time on my headphones 😛
  • I’m glad that despite my slow posting rate, the blog still kept getting regular traffic—particularly Is a Master’s degree in Statistics worthwhile? I guess it’s a burning question these days.
  • A big help to my sanity this semester came from joining the All University Orchestra. After a long week of tough classes and research setbacks, it’s great to switch brain modes and play my clarinet. I’ve really missed playing for the past few years in DC, and I’m glad to get back into it.
  • Pittsburgh highlights: Bayernhof museum, Pittsburgh Symphony Orchestra concerts (The Legend of Zelda, “Behind the Notes” talks), Jozsa Corner, Point Brugge Cafe, sampling all the Squirrel Hill pizzerias, MCMC Bar Crawl on the Southside Flats, riding the ridiculously steep inclines, Pittsburgh Area Theater Organ Society concerts and tours of their beautiful theater organ
  • Things still on our list to do in Pittsburgh: see a CMU theater performance, Pittsburgh aviary and zoo, Kennywood amusement park, Steelers game, Penguins game
  • I look forward to getting a chance to teach a whole course this summer. It’ll be 36-309, Experimental Design. I also took some Eberly Center seminars, and the department organized helpful planning meetings for those of us students who’ll teach in the summer, so I feel reasonably prepared.
    I plan to have my students design a series of experiments to bake the ultimate chocolate chip cookie. It will be delicious. I baked Meg Hourihan’s mean chocolate chip cookies for a department event earlier this spring, which seems like an appropriate start.
    However, ironically, as the local knitr / reproducible research fanboy… I’m supposed to teach the course using SPSS, which seems to be largely point-and-click, without much support for reproducible reports 🙁
  • It was a nice difference to be on the other side of the department’s open house for admitted students this year 🙂 I’m also happy to be reading Grad Cafe forums from a much more relaxed point of view this year!
  • I’m surprised there’s not much crossover between the CMU and UPitt statistics departments. And the stats community outside each department doesn’t seem as vibrant as it was in DC. I attended the American Statistical Association’s Pittsburgh chapter banquet. Besides CMU and Pitt folks, most attendees seemed to be RAND employees or independent consultants. There are also some Meetup groups: the Pittsburgh Data Visualization Group and the Pittsburgh useR Group.
  • I’ve updated and expanded my CMU blogroll in the sidebar. Please let me know if I missed your CMU/Pittsburgh statistics-related blog!

Other people’s helpful posts on the PhD experience:

Next up: the 3rd, 4th, 5th, 6th, 7th, 8th, 9th, and 10th semesters of my Statistics PhD program.

‘Census Marketing’ app by Olin College students

I love having the chance to promote nifty data visualizations; good work from my former employer, the Census Bureau; and student projects from my alma mater, Olin College. So it’s a particular pleasure to highlight all three at once:

Elizabeth Duncan and Marena Richardson, students in Olin’s Data Science course, teamed up with Census staff and BusinessUSA to develop an app that helps make Census data accessible to small business owners.

CensusMarketing

The result, Census Marketing, is a nifty and simple interface to overlay Decennial Census and American Community Survey data on Google Maps.

Imagine you’re planning to start or expand a small business, and you know the demographic you’d like to target (age, income, etc.) Where in your town is there a high concentration of your target market? And, are there already competing businesses nearby?

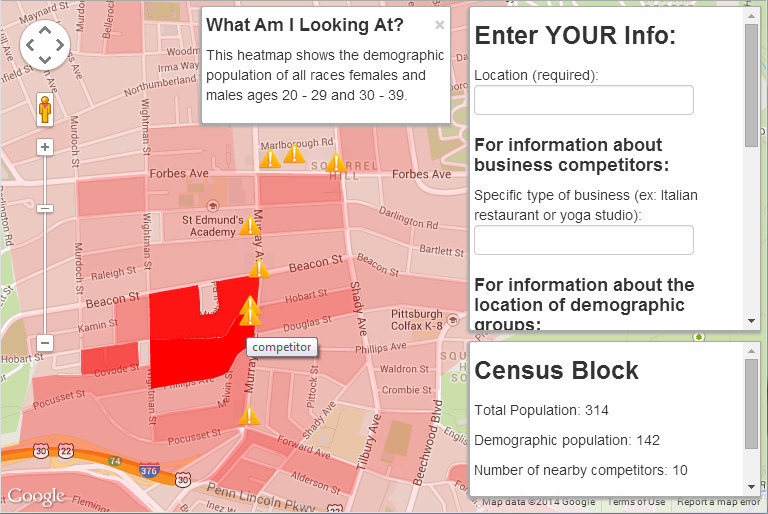
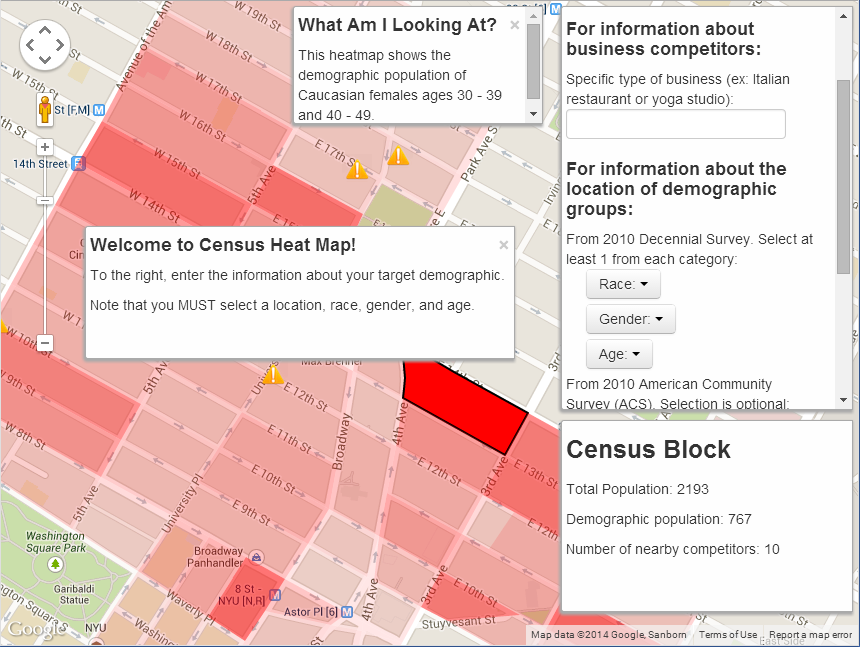
Load up Duncan and Richardson’s website, enter your location, select demographic categories from a few drop-down menus, and give your business type. The app will go find the relevant data (through the Census API) and display it for you as a block-level heatmap on Google Maps. It’ll also highlight the locations of existing businesses that might be competitors.

For example, say you want to open a pizzeria in my Pittsburgh neighborhood of Squirrel Hill. You might want to target the undergrad and grad student populations, since they tend to order pizza pretty often. Punch in the zip code 15217, choose all races and both sexes, select age groups 20-29 and 30-39, and specify that you’re looking for other competing pizzerias:

CensusMarketing_SqHillPizza

Well! The student-age population is clearly concentrated around Hobart and Murray… but so are the competing pizzerias. Good to know. Maybe you need to brainstorm a new business plan, seek out a different part of town, or try marketing to a different demographic.

Besides learning about data science and creating a website, Duncan and Richardson also interviewed several actual small business owners to refine the user experience. It’s a nice example of Olin’s design-centered approach to engineering education. I can imagine a couple of further improvements to this app… But it’s already a nice use case for the Census API, and a good example of the work Olin students can do in a short time.

PS—the course instructor, Allen Downey, has a free book ThinkStats on introductory statistics from a computer scientist’s point of view. I hear that a revised second edition is on its way.

Other students’ views on CMU’s Statistics department

(1) There are a couple of nice posts on Quora answering “What is it like to be a graduate student in Statistics at CMU?”
(If you don’t want to sign in to Quora, you might be able to read the replies through these direct links: Jack, Alex, Sangwon.)

(2) When I was applying to schools, a fellow PhD student here shared his thoughts about CMU’s Statistics department. He kindly allowed me to share his comments here as a guest post, though he warns it may be a year or two out of date.

In probably all graduate programs, but at least at CMU, graduate study consists of a coursework component and a research component. (You can see the curriculum here, and while they keep tweaking it, this looks like it’s more or less up to date.) As you can see, the balance starts out tilted heavily toward coursework and gradually starts to shift toward research, so that by your fourth semester you are mostly doing research. This makes sense – it would be tough to do much research-wise without at least some foundational methodological and theoretical training.

A key component of the easing-in process is the well-designed but not particularly well-named Advanced Data Analysis (“ADA”) course, which is a yearlong project spanning your second and third semesters. In this, you choose a professor to work with (they all give presentations about their work first semester to give you a sense of whom to choose), and this professor arranges a relationship with an outside investigator — a “real scientist”, not a statistician, usually in some other department at CMU or Pitt — who has data for you to analyze. Then the three (or more) of you work on the problem of analyzing that data for a year, meeting relatively frequently to discuss progress and whatever issues may arise. You also produce reports and presentations on the project as milestones.

So I’m now at the beginning of my second year, in the midst of my ADA project as well as the Advanced Stat Theory class. To give you a sense of an ADA project, I am working with two professors from Stats and one from CMU Astrophysics on a data set consisting of galaxies, trying to develop predictive models for galaxy redshift purely by analyzing these images. Other ADA projects right now include applications to educational testing, the genetic basis of autism, and medical studies of dementia.

So with that said, while I’m not in the full-blown research part of the PhD, I’ve still had the opportunity to work closely with professors and it has been very fruitful. They tend to be accessible and willing to meet as often as I want to, which tends to be once a week or every other week. My experience with research is that we’ll meet and talk about stuff, then I’ll go home and try whatever new stuff is suggested, and when I have something to show or have hit a wall, we meet again to talk about it. I’ve also started going to the meetings of the Astrostatistics group, which is a collaborative research effort between CMU Stats, CMU Astrophysics, and Pitt Astronomy, and hearing about all the research that’s being done in that setting.

I think the way CMU structures the research experience speaks to how much emphasis it places on acclimating you to that environment, which is really quite different from the classroom. Regarding the coursework component, most of the classes I’ve had here have been well-taught, and the professors hold office hours and generally welcome student inquiry. I think the professors, for the most part, do an admirable job of juggling their research and teaching without short-changing one piece or the other. I’ve definitely learned a ton from classes, which is important because my background in statistics was rather weak coming in. (I had a solid foundation in Math and CS, but not a ton of exposure to Stats.)

Regarding the distinguishing qualities of the program, there are a few. Among the spectrum of theoretical vs. applied programs, it tends to skew applied — there are a few people doing theory but many more working on applications to various fields. (This could be a good thing or a bad thing depending on your taste.) But if you ask people here, they might say the distinction between theoretical and applied work is kind of silly, since advances in theory can yield new methodology and novel applications can motivate development of theory. But anyhow, given that professors do a lot of applied work, there are fertile collaborations here with quite a few disciplines — astrostatistics as I mentioned, neuroscience, CS/machine learning, genetics, even some people working on finance/economics problems. So it’s not limiting at all in terms of what you can work on.

Another good thing about the program is that it’s pretty current and (you might say) somewhat pragmatic. For instance, they just revamped our Advanced Stat Theory core course to be taught with a huge focus on nonparametric inference instead of the canonical/classical inference theory, because it turns out that most people in real-world research settings are using nonparametric methods much more. In general, it’s great when a department recognizes that a field is evolving (rapidly!) and they are willing to adapt to cover what will be useful for students rather than what they became famous for writing books about in the ’70s.

That’s all I can think of now. Best of luck with the application process!

More on graduate study for careers in Statistics

First, the Science career magazine has a good article, “Careers in Statistics Evolve and Expand,” with job growth projections and a few interviews. However, there’s not much direct advice on how to land one of these jobs.

Meanwhile, I’ve received a couple more emails asking how best to prepare for Statistics careers. If you’re an employer, or a recent graduate, do you have any advice to share?

First email:

I am working in the area of cancer research. After spending some time doing clinical data analysis and working on genomics, I realized data analysis is something I really enjoy. I have already started learning Python and R. But considering my background and no proper academic training in math/stat, how do I go about getting a job in industry related to big data? Do you think getting a Master’s would help? Even for Master’s I would need undergrad courses in Math/Lin Algebra.

My response:

Python and R are great tools to work with, so it’s good that you’ve been learning those.

What kind of big data jobs are you interested in? Unfortunately, I don’t have too much advice about industry jobs, since my time has been mostly in government and academia.*

In general, I think there’s great value in having a rigorous statistics background when doing data analysis, so that you know the limitations of your data and your conclusions. However, some employers might prefer you to have expertise in fast algorithms or big-data tools like Hadoop (which most statistics Masters programs don’t really cover). If you’d like to work in such positions, you may prefer to focus on learning programming or computer science.

If you do go for a Masters in statistics, you will definitely want to brush up on calculus and linear algebra. These mathematical foundations are needed for stating (and proving) core concepts in statistics.

Second email:

My undergraduate degree is in a humanities field, but I have been taking computer science, stats, and math courses so that I could apply to either a Masters in Comp Sci or in Statistics. I really enjoy stats, and I have done well in all of my stats classes, including a graduate level course. It also fits in well with my interest in information and how to understand and manipulate it in order to make it understandable.

I feel like my interests and background make the Applied Statistics degree more what I am looking for. I am also thinking that the online option might be a good idea because it would allow me to build my contacts through part-time work or internships.

Anyways, since you have such as varied background, I am wondering what your thoughts are on the professional Masters in Applied Statistics program and whether it would be a way for me to get into the stats field, or if it is looked down on by employers? Also, what do you think of the residency vs. online options?

And my response:

Do you know what you’d like to do in statistics, once you have the degree? Are you interested in academia, industry, consulting, government, healthcare, etc?

My work experience was in government, where the hiring standards are pretty explicit. For example, most Masters programs would prepare you well for work at the Census Bureau at the GS-09 grade level, as I did with my Masters. Here’s the job posting and other related opportunities. As long as the online program is properly accredited, the fact that it’s online shouldn’t matter for government jobs.

But I don’t have much experience with industry jobs, and hiring there has changed a lot in the 5 years since I last applied for jobs.* Google searches for “data scientist” only picked up around 2012 🙂

GoogleTrendsDataSci

Finally, just in case you haven’t taken online courses before, I’d recommend trying some before you sign up for an all-online degree. Personally I’ve found I learn much better when I come to class regularly and talk to professors in person. But if that’s not an issue for you, then it sounds great to have the flexibility to do part-time work or internships. That kind of practical experience should help a lot on the job hunt too.

*Clearly, I should really ask one of our recent graduates from CMU’s 1-year Masters in Statistical Practice to write a post about their experience on the job hunt this semester. They’d have a much better idea of how prospective employers today look at stats Masters degrees.

Related posts:

For CMU specifically:

Belief-Sustaining Inference

TL;DR: If you’re in Pittsburgh today, come to SIGBOVIK 2014 at CMU at 5pm for free food and incredible math!

In a recent chat with my classmate Alex Reinhart, author of Statistics Done Wrong, we noticed a major gap in statistical inference philosophies. Roughly speaking, Bayesian statisticians begin with a prior and a likelihood, while Frequentist statisticians use the likelihood alone. Obviously, there is scope for a philosophy based on the prior alone.

We began to develop this idea, calling it Belief-Sustaining Inference, or BS for short. We discovered that BS inference is extremely efficient, for instance getting by with smaller sample sizes and producing tighter confidence intervals than other inference philosophies.

Today I am proud dismayed complacent to report that our resulting publication has been accepted to the prestigious adequate SIGBOVIK 2014 conference (for topics such as Inept Expert Systems, Artificial Stupidity, and Perplexity Theory):

Reinhart, A. and Wieczorek, J. “Belief-Sustaining Inference.” SIGBOVIK Proceedings, Pittsburgh, PA: Association for Computational Heresy, pp. 77-81, 2014. (pdf)

Our abstract:

Two major paradigms dominate modern statistics: frequentist inference, which uses a likelihood function to objectively draw inferences about the data; and Bayesian methods, which combine the likelihood function with a prior distribution representing the user’s personal beliefs. Besides myriad philosophical disputes, neither method accurately describes how ordinary humans make inferences about data. Personal beliefs clearly color decision-making, contrary to the prescription of frequentism, but many closely-held beliefs do not meet the strict coherence requirements of Bayesian inference. To remedy this problem, we propose belief-sustaining (BS) inference, which makes no use of the data whatsoever, in order to satisfy what we call “the principle of least embarrassment.” This is a much more accurate description of human behavior. We believe this method should replace Bayesian and frequentist inference for economic and public health reasons.

If you’re around CMU today (April 1st), please do stop by SIGBOVIK at 5pm, in Rashid Auditorium in the Gates-Hillman Center. There will be free food, and that’s no joke.

Bayesian statistics and applied computing at CMU?

A reader asks:

I wanted to pick your brain about stats and machine learning at CMU … I’m considering a Ph.D. in a finance or a related discipline.

Here’s the thing, I’m very much attracted to schools with established inter-disciplinary programs, like CMU’s additional masters in machine learning, and Duke’s supplemental masters in statistics. Duke bills itself as the best Bayesian shop under the sun, which is also attractive. I’m not dogmatically fixed on Bayesian methods, but I do find it a much more natural way of thinking, and more naturally applied to practical problems.

One person I spoke to suggested that Duke was the better program based on my interests, but I read on your blog that Bayesian methods and applied computing are pretty well represented at CMU, so I figured I’d get your thoughts. Leaving aside the reality that one can’t choose where they’re admitted, and that one should focus their choice on the strength of their primary department, I’d like to know which would be the better option.

My response:

I admit I don’t know much about the finance program here, nor about the supplemental masters in ML. And of course I know even less about Duke’s equivalent programs.

That said, CMU is absolutely a strong place for machine learning and statistics, including applied computing and Bayesian statistics.

Bayes:

  • The core courses for the ML masters (10-701, 10-702, and 10-705) do cover Bayesian methods and inference. We study the basic theory and plenty of applications, including less-often-taught methods like Bayesian nonparametrics. Parts of 702 and 705 are especially helpful for clarifying how Frequentist and Bayesian inferences differ. Although I’m a fan of the Bayesian approach, I really appreciate how Larry Wasserman challenges us to understand its weaknesses thoroughly, using plenty of examples where Classical methods have an advantage over Bayesian ones (such as Sec 12.6 here).
  • Beka Steorts also offers a pair of courses that go into more depth on Bayesian theory and applications.
  • There’s also a close link between the Statistics and Philosophy departments: particularly Kadane and Schervish here in Stats, and Seidenfeld in Phil, work together regularly on the foundations of statistical inference, incl. Bayesian.

ML and applied computing:

I’m sure that you’d find CMU worthwhile if you end up coming here.

See also my posts on:

and CMU’s Department of Statistics, Department of Machine Learning, and Secondary Masters in Machine Learning.

With loss of generality

Public service announcement: Dear math and statistics students, “WLOG” means you’re about to prove something “without loss of generality.”

So please don’t copy your friend’s homework and write it as “with log” or “using log”. It’s just too easy for your grader to catch you.

â™Ș The more you know! ♫

Reproducible research, training wheels, and knitr

Last week I gave a short talk at CMU’s statistical computing seminar, Stat Bytes. I summarized why reproducible research (RR) and literate programming are worthwhile, not just for serious research but also for homework reports or statistical blog posts. I demonstrated how to get started with a range of RR document formats in R: from the “training wheels” R Notebook in RStudio, through the more flexible but still simple R Markdown format, to R Sweave for \LaTeX articles and Beamer slides.

If you’ve wanted to get on the RR bandwagon, but found Sweave too overwhelming, these other tools are a great way to start—and useful in their own right, not just for training.

My materials are here:

  • Overview and links (html output, Rmd source)
  • R Notebook example (html output, R source)
  • R Markdown example (html output, Rmd source)
  • R Sweave / Beamer example (pdf output, Rnw source)

Extra details below.

Reproducible research story time

First, story time! I was once asked to step in and take over the statistical analysis for an article, after the primary statistician became unavailable. It sounded like a pretty straightforward analysis of survey data, with clear scientific questions, and they told me they had the previous statistician’s R code, so I thought it sounded reasonable. Hah…

Continue reading “Reproducible research, training wheels, and knitr”

After 1st semester of Statistics PhD program

Have you ever wondered whether the first semester of a PhD is really all that busy? My complete lack of posts last fall should prove it 🙂

Some thoughts on the Fall term, now that Spring is well under way [edit: added a few more points]:

  • RMarkdown and knitr are amazing. When I next teach a course using R, my students will be turning in homeworks using these tools: The output immediately shows whether the code runs and what its results are. This is much better than students copying and pasting possibly-broken code and unconnected output into a text file or (gasp) Word document.
  • I’m glad my cohort socializes outside the office, taking each other out for birthday lunches or going to see a Pirates game. Some of the older PhD students are so focused on their thesis work that they don’t take time for a social break, and I’d like to avoid getting stuck in that rut.
    However! Our lunches always lead us back to the age old question: How many statisticians does it take to split a bill? Answer: too long. I threw together a Shiny app, DinneR, to help us answer this question 🙂

DinneR

  • The first-year PhD courses in Statistics and in Machine Learning have rather different approaches.
    • Statistics professor: Just assume we can compute this estimator. In class we’ll prove that the estimates are reasonably good (e.g. we’ll bound the probability that an estimate is far from the true value).
    • Machine Learning professor: Just trust me that this algorithm gets useful estimates. In class we’ll prove that we can compute it in a reasonable amount of time (e.g. we’ll bound the number of steps until the algorithm converges).
    • Somewhere between these ideas, I ran into the sensible concept of optimizing only until your solution is within statistical error. For example, say you only have enough data to publish an estimate with a confidence interval of +\- 0.1 units. If your optimization algorithm is computer-intensive, then running it until it converges to +\- 0.00001 units is just a waste of time. For instance, see Bottou & Bousquet’s “The Tradeoffs of Large Scale Learning.”
  • My ML professor, midway through a classification-focused semester, finally discussing regression for 10 minutes: “…And that’s all you need to know about regression.”
    My Regression professor, at end of semester, finally discussing classification for 20 minutes: “…And that’s all you need to know about classification.” 🙂
  • In any class that covers proofs or other long detailed arguments, handouts+chalkboards are seriously better than slideshows. With a chalkboard, you can show the whole proof at once—so if students get lost halfway through, they can still see the claim we’re proving and all the steps we’ve made so far. But when you cram a proof onto slides, either you oversimplify to get it onto one slide; or you split it across slides, so that we lose the continuity (and may even forget what we’re trying to prove).
  • Good homeworks and quick feedback are critical. One of my classes had weekly homeworks, each directly tied to the material we just covered, each problem expanding on a good question or illustrating an interesting principle from class. Homeworks were graded within a week, every single time.
    In another class, we had just a few homeworks, very loosely tied to the lecture contents and usually at a very different level (way too easy or too hard relative to what the lecture covered). Although this class had the same number of students and TAs as the other one, we never got our homeworks back in less than 2 weeks—and one of them took a full 2 months to return!
  • TAing is a mixed bag. I enjoy holding office hours and being there during lab sessions to help students understand something they were missing. I do not so much enjoy grading homeworks and labs by those students who don’t ask questions, don’t come to office hours, and clearly don’t read the comments I leave on their assignments since I see them make the same mistakes over and over. I especially don’t like finding instances of cheating. Urgh.
  • I was a bit worried about coming back to grad school as an “older” student (the youngest guy in our 1st-year PhD cohort is almost a decade younger than me!). But it’s been great, actually:
    • My schedule seems much saner than some of my classmates’. Quite a few seem to stay in the office until late most nights, then may sleep through a morning class. For me, after years of waking at 6:30 to spend an hour on the crowded metro to work… it’s been luxurious to sleep in until 7:30 or 8, walk to school in half an hour in the fresh air, have a focused workday of reasonable length, and come home for dinner with my wife, actually relaxing in the evening instead of studying until 3am. Yes, there’s the occasional late night, but occasional is the key word there.
    • The income’s lower than my old job, of course, but Pittsburgh is much cheaper than DC, especially for housing. Besides: my previous school loans are all paid off, I have a fair chunk of retirement savings already earning interest, and my wife and I are used to budgeting. (YNAB is an excellent tool for this—I will blog about it at some point. If you’re interested, here’s a slight discount referral code, or you can wait for the big sale they seem to have every 3-4 months.)
      [My point is: despite the drop in income, we’re still more financially secure (thanks to savings and paid-off loans) than if I’d gone straight into the PhD from my MSc.]
    • As Cosma Shalizi points out: “Note to graduate students: It is important that you internalize that you are, in fact, a badass…” With age and experience, I’m far more able to speak confidently when it’s called for (e.g. giving a talk), and far less intimidated about tackling new topics, talking to professors, writing papers, speaking at conferences, etc.
  • On the other hand, despite longer experience as a statistician than my classmates, I appreciate and admire that they are much better at many things. I’m really impressed by my various classmates’ command of topics like real analysis and measure theory, scientific computing, or practical knowledge about fields like physics or economics.
  • Pittsburgh is a great town. Affordable housing, decent bus system, beautiful scenic views from the inclines, friendly people, livable walkable neighborhoods, tons of good food, extensive and well-run library system… It has a lot of what I liked about Portland, without as much of the “Portlandia” over-the-top hipsters. There are also beautiful old buildings, like the Carnegie Natural History Museum (with its sweet dinosaur exhibit) and UPitt’s Cathedral of Learning. The weather right now is pretty snowy/icy, but I don’t mind—I’m honestly impressed by how well Pittsburgh just goes ahead and deals with winter weather, in comparison to DC’s city-wide shutdown every time a snowflake is sighted.

Edit: Here’s another good post on the first semester of a PhD program, from several mathematics students. I agree with most of the responses, especially the ones that conflict each other 🙂

Next up: the 2nd, 3rd, 4th, 5th, 6th, 7th, 8th, 9th, and 10th semesters of my Statistics PhD program.
Data-Driven Journalism MOOC

TL;DR: The Knight Center’s free online journalism courses are great for anyone who works with data, storytelling, or both. See what’s being offered here.
My favorite links from a recent course on Data-Driven Journalism are here.
And a fellow student’s suggested reading list is here.

Last fall, a coworker and I led a study group for the Knight Center‘s MOOC (massive open online course) on “Introduction to Infographics and Data Visualization”, taught by Alberto Cairo. The course and Alberto’s book were excellent, and we were actually able to bring Alberto in to the Census Bureau for a great lecture a few months later. This course is now in its 3rd offering (starting today!) and I cannot recommend it highly enough if you have any interest in data, journalism, visualization, design, storytelling, etc.!

So, this summer I was happy to see the Knight Center offering another MOOC, this time on “Data-Driven Journalism: The Basics”. What with moving cities and starting the semester, I hadn’t kept up with the class, but I’ve finally finished the last few readings & videos. Overall I found a ton of great material.

The course’s five lecturers gave an overview of data-driven journalism: from its historical roots in the 1800s and its relation to computer-aided reporting, to how to get data in the first place, through cleaning and checking the data, and finally to building news apps and journalistic data visualizations.

In week 3 there was a particularly useful exercise of going through a spreadsheet of hunting accidents. Of course it illustrated some of the difficulties in cleaning data, and it gave concrete practice in filtering and sorting. But it was also a great illustration of how a database can lead you potential trends or stories that you might have missed if you’d only gone out to interview a few individual hunters.

I loved some of the language that came up, such as “backgrounding the data” — analogous to checking out your sources to see how much you can trust them — or “interrogating the data,” including coming prepared to the “data interview” to ask thorough, thoughtful questions. I’d love to see a Statistics 101 course taught from this perspective. Statisticians do these things all the time, but our terminology and approach seem alien and confusing the first few times you see them. “Thinking like a journalist” and “thinking like a statistician” are not all that different, and the former might be a much more approachable path to the latter.

For those who missed the course, consider skimming the Data Journalism Handbook (free online); Stanford’s Data Journalism lectures (hour-long video); the course readings I saved on Pinboard; and my notes below.
Edit: See also fellow student Daniel Drew Turner’s suggested reading list.
Then, keep an eye out for next time it’s offered on the Knight Center MOOC page.

Below is a (very messy) braindump of notes I took during the class, in case there are any useful nuggets in there. (Messiness due to my own limited time to clean the notes up, not to any disorganization in the course itself!) I think the course videos were not for sharing outside the class, but I’ve linked to the other readings and videos.

Continue reading “Data-Driven Journalism MOOC”