I am sorry to hear that Rob Santos has resigned from being director of the US Census Bureau.
Robert Santos decides to resign as US Census Bureau director midway through a 5-year term … [Santos] said in a letter Thursday evening that he made the decision “after deep reflection.” … The Texas native said in his letter that he planned to spend time with his family in retirement. [AP]
Dr Santos was also a past President of the ASA (American Statistical Association) and, from what I’ve heard, well-respected as the director at the Census Bureau.
I am wondering whether this letter is publicly available. I have not seen it on news sources or the Census Bureau website. Dr Santos’ LinkedIn post about the resignation merely says “It’s been such an honor to serve our nation.”
I had hoped Dr Santos would stay on through his full 5-year term, as long as possible, to minimize politicization (or appearance thereof) of the Census Bureau’s work.
Beyond the Census Bureau, there is plenty of other statistical turmoil at the moment:
At the direction of the Trump administration, the federal Department of Health and Human Services and its agencies are purging its websites of information and data on a broad array of topics — from adolescent health to LGBTQ+ rights to HIV. [NPR]
I would love for the current ASA leadership to rally its members, helping us to work together to support our federal statistical agencies and statistical civil servants.
It’s been a while. Years ago in 2017, I posted with concern but cautious optimism about the integrity of federal statistical data. Now in 2025, as that presidential administration returns to power, these concerns (and many others) are much sharper than ever before.
First of all, an atmosphere of “you’d better tattle on your colleagues or else you’ll get in trouble too” pervaded Communist-era 1980s Poland where I was born. That was a major reason why my parents fled to the USA with me, to raise me in a country where you could speak freely and trust your neighbors, because such snitching obviously had no place here. Now it is chilling to see that same kind of message coming directly from the top of the US executive branch:
In a new message distributed on Wednesday, government employees were warned they would face “adverse consequences” if they failed to promptly report any hidden DEI programs. […] “There will be no adverse consequences for timely reporting this information. However, failure to report this information within 10 days may result in adverse consequences,” the memo said. [Reuters]
Next, there are heavy-handed, unsubtle attempts to discourage hiring and retention of top talent across the government, likely leading to worse outcomes, leading to a feedback loop that “justifies” even more whittling down of talent and institutional knowledge in the name of “efficiency.”
Elon Musk and Vivek Ramaswamy, whom Trump appointed to lead his Department of Government Efficiency, or DOGE, suggested that requiring federal employees to return to the office five days a week “would result in a wave of voluntary terminations that we welcome.” [NPR]
Finally, focusing back on statistical data: There are also heavy-handed, unsubtle attempts to discourage participation in the decennial Census, likely leading to poorer data quality, leading to further erosion of trust in shared facts. We can’t even collect good data to begin with if we lose the public’s trust; so even if the Census changes are ultimately blocked, the fact that this has come up at all means that harm is already underway. (And if the administration’s changes do go through, they may reap further partisan advantages from changes to apportionment for the House of Representatives as well as future redistricting.)
Among the dozens of Biden-era executive orders that President Trump revoked on Monday was one that had reversed the first Trump administration’s unprecedented policy of altering a key set of census results. […] Biden’s now-revoked 2021 order affirmed the longstanding practice of including the total number of persons residing in each state in those census results. It was issued in response to Trump’s attempt during the national tally in 2020 to exclude millions of U.S. residents without legal status. [NPR]
Including a citizenship question, Passel adds, “introduces another source of potential error into the census, and it undermines public confidence in the data as well.” [NPR]
I admit the US federal statistical system wasn’t perfect by any means before this…
In recent months, budget shortfalls and the restrictions of short-term funding have led to the end of some datasets by the Bureau of Economic Analysis, known for its tracking of the gross domestic product, and to proposals by the Bureau of Labor Statistics to reduce the number of participants surveyed to produce the monthly jobs report. […] Potok says she’s currently working on an update to an American Statistical Association report released last year [in July of 2024] to sound the alarm on the risks facing the country’s data. That report concluded that the main threats to the statistical agencies include declining public participation in surveys, not enough laws to help protect the data’s integrity from political interference and neglect from congressional appropriators. [NPR]
PS — Nowadays Poland is doing leagues better today than when we left in the 1980s. But even there, we still have concerns about the independence of statistical agencies from political manipulation:
The International Statistical Institute (ISI) and the American Statistical Association (ASA) have raised concerns regarding the recent dismissal of Dominik Rozkrut as President of Statistics Poland (Główny Urząd Statystyczny – GUS). In a joint letter addressed to Prime Minister Donald Tusk, the organisations emphasised the vital role of professional independence in maintaining the credibility and trustworthiness of official statistics. The letter, dated 26 December 2024, highlights the importance of statistical institutions as cornerstones of evidence-based decision-making in democratic societies. The ISI and ASA warned that any threats to the independence of statistical leaders could erode public trust and undermine the integrity of official data. [ISI]
The fall semester is over. Time to kick back and relax with… data analysis puzzles? Yes, of course!
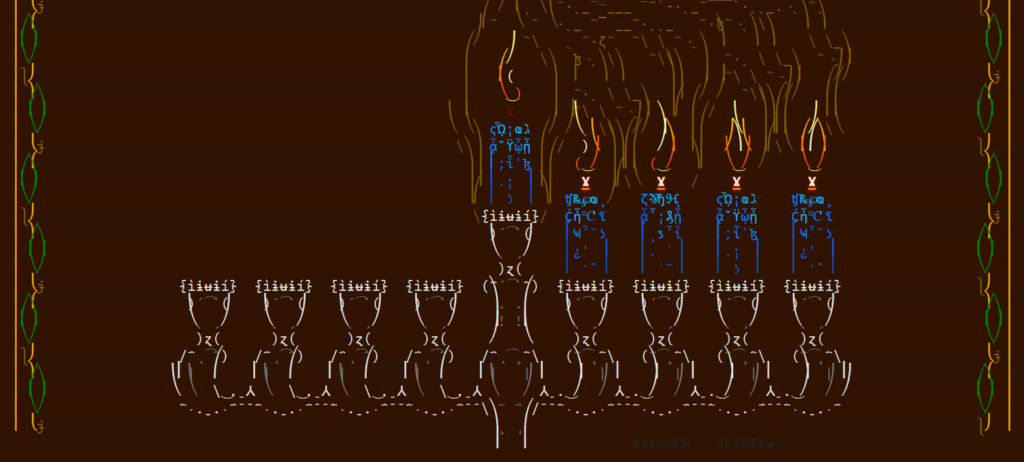
The creators of the VisiData software have put together a “Hanukkah of Data,” 8 short puzzles released one day at a time. Four have been released already, but there’s still time for you to join in. From their announcement:
If you like the concept of Advent of Code, but wish there was set of data puzzles for data nerds, well, this year you’re in luck!
We’ve been hard at work the past couple of months creating Hanukkah of Data, a holiday puzzle hunt, with 8 days of bite-sized data puzzles. Starting December 18th, we’ll be releasing one puzzle a day, over the 8 days of Hanukkah.
This is your chance to explore a fictional dataset with SQL or VisiData or Datasette or your favorite data analysis tool, to help Aunt Sarah find the family holiday tapestry before her father notices it’s missing!
Register here to receive notifications when puzzles become available.
I can’t remember where I heard about this, but I’m very glad I did. I wasn’t familiar with VisiData before this, but I look forward to giving it a try too. For now, I’m just using R and enjoying myself tremendously. The puzzles are just the right length for my end-of-semester brain, the story is sweet, and the ASCII artwork is gorgeous. Many thanks to Saul Pwanson and colleagues for putting this together.
Are there other efforts like this in the Statistics and/or R communities? Hanukkah of Data is the kind of thing I would love to assign my students to help them practice their data science skills in R. Here are closest other things I’ve seen, though none are quite the same:
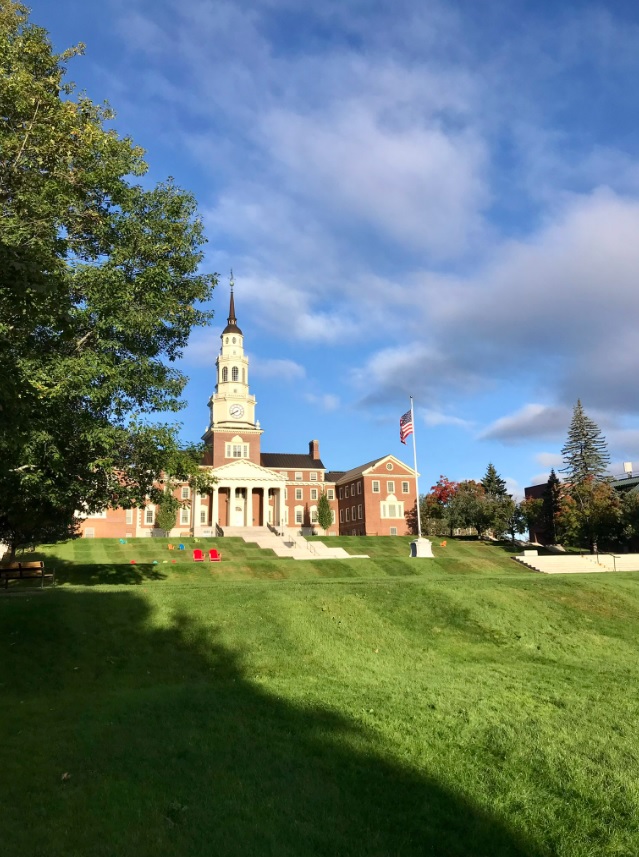
We’re hiring for a tenure-track faculty member in Statistics! Are you interested in teaching at a beautiful small liberal arts college in Maine? Are you looking for academic positions that value a balance of teaching & research — and provide resources to support you in both regards? Not to mention a competitive salary, good benefits, and all four seasons in a small New England town? Please do apply, and reach out to me with any questions, or share the ad with anyone you know who might be a good fit:
We will start reviewing applications on October 24 and continue until the position is filled.
(And if you’re not just a solo statistician, but you are working on a two-body problem with a computationally-focused partner, then let me also note that both our Davis AI Institute and our CS department are hiring too this year.)
Some new developments since last time we had a faculty search in Statistics:
In addition to our Data Science minor, we are close to approving a Data Science major in collaboration with Colby’s departments of Mathematics and of Computer Science
In terms of research, there are generous startup funds (more than I’ve been able to use so far) and plenty of other support for research materials, conference travel, etc.
The teaching load is 9 courses every 2 years. That comes out to 2 courses most semesters, and 3 every fourth semester. While we provide regular offerings of Intro Stats, Statistical Modeling, and other core courses, in a typical year each of us also gets to teach a favorite elective or two. For example, I have gotten to work on some great partnerships by planning Survey Sampling or Data Visualization courses with our Civic Engagement office. My students have shown care, respect, and insight as they help our local homeless shelter study what resources improve housing outcomes; or help our town fire department to survey citizens and local businesses to inform its five-year plan.
And frankly, it’s just plain fun to work across disciplines. I’ve help a Government major figure out how to collect & analyze a random sample of news articles for a project on public transport in Central America. I’ve helped a Biology professor figure out how to bootstrap an imbalanced experiment on amoebas, and I’ve learned nifty nuggets of data visualization history from an English professor.
Long story short: I really do enjoy teaching statistics in the liberal arts college environment. If you think you would too, come join us!
I’m fortunate to be able to report the publication of a paper and associated R package co-authored with two of my undergraduate students (now alums), Cole Guerin and Thomas McMahon: “K-Fold Cross-Validation for Complex Sample Surveys” (2022), Stat, doi:10.1002/sta4.454 and the surveyCV R package (CRAN, GitHub).
The paper’s abstract:
Although K-fold cross-validation (CV) is widely used for model evaluation and selection, there has been limited understanding of how to perform CV for non-iid data, including from sampling designs with unequal selection probabilities. We introduce CV methodology that is appropriate for design-based inference from complex survey sampling designs. For such data, we claim that we will tend to make better inferences when we choose the folds and compute the test errors in ways that account for the survey design features such as stratification and clustering. Our mathematical arguments are supported with simulations and our methods are illustrated on real survey data.
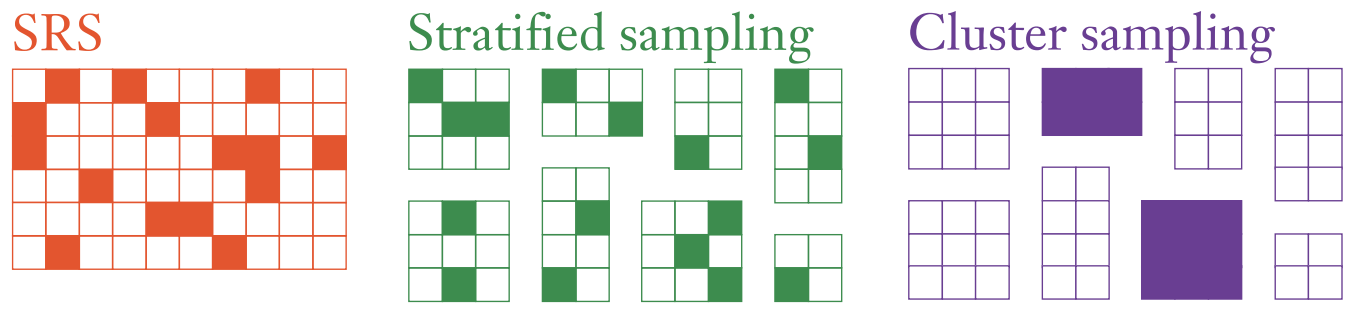
Long story short, traditional K-fold CV assumes that your rows of data are exchangeable, such as iid draws or simple random samples (SRS). But in survey sampling, we often use non-exchangeable sampling designs such as stratified sampling and/or cluster sampling.1
Our paper explains why in such situations it can be important to carry out CV that mimics the sampling design.2 First, if you create CV folds that follow the same sampling process, then you’ll be more honest with yourself about how much precision there is in the data. Next, if on these folds you train fitted models and calculate test errors in ways that account for the sampling design (including sampling weights3), then you’ll generalize from the sample to the population more appropriately.
If you’d like to try this yourself, please consider using our R package surveyCV. For linear or logistic regression models, our function cv.svy() will carry out the whole K-fold Survey CV process:
generate folds that respect the sampling design,
train models that account for the sampling design, and
calculate test error estimates and their SE estimates that also account for the sampling design.
For more general models, our function folds.svy() will partition your dataset into K folds that respect any stratification and clustering in the sampling design. Then you can use these folds in your own custom CV loop. In our package README and the intro vignette, we illustrate how to use such folds to choose a tuning parameter for a design-consistent random forest from the rpms R package.
Finally, if you are already working with the survey R package and have created a svydesign object or a svyglm object, we have convenient wrapper functions folds.svydesign(), cv.svydesign(), and cv.svyglm() which can extract the relevant sampling design info out of these objects for you.
It was very rewarding to work with Cole and Thomas on this project. They did a lot of the heavy lifting on setting up the initial package, developing the functions, and carrying out simulations to check whether our proposed methods work the way we expect. My hat is off to them for making the paper and R package possible.
Some next steps in this work:
Find additional example datasets and give more detailed guidance around when there’s likely to be a substantial difference between usual CV and Survey CV.
Build in support for automated CV on other GLMs from the survey package beyond the linear and logistic models. Also, write more examples of how to use our R package with existing ML modeling packages that work with survey data, like those mentioned in Section 5 of Dagdoug, Goga, and Haziza (2021).
Try to integrate our R package better with existing general-purpose R packages for survey data like srvyr and for modeling like tidymodels, as suggested in this GitHub issue thread.
Work on better standard error estimates for the mean CV loss with Survey CV. For now we are taking the loss for each test case (e.g., the squared difference between prediction and true test-set value, in the case of linear regression) and using the survey package to get design-consistent estimates of the mean and SE of this across all the test cases together. This is a reasonable survey analogue to the standard practice for regular CV—but alas, that standard practice isn’t very good. Bengio and Grandvalet (2004) showed how hard it is to estimate SE well even for iid CV. Bates, Hastie, and Tibshirani (2021) have recently proposed another way to approach it for iid CV, but this has not been done for Survey CV yet.
Meng is one of the coauthors of this new Nature paper, which discusses the Big Data Paradox in context of concerns about two very large but statistically-biased US surveys related to the COVID-19 pandemic: the Delphi-Facebook survey and the Census Household Pulse survey. As someone who has worked with both the Delphi group at CMU and with the Census Bureau, I can’t help feeling a little defensive 🙂 but I do agree that both surveys show considerable statistical bias (at least nonresponse bias for the Census survey; and biases in the frame and sampling as well as nonresponse for the Delphi survey). More work is needed on how best to carry out & analyze such surveys. I don’t think I can put it any better myself than Frauke Kreuter’s brief “What surveys really say”, which describes the context for all of this and points to some of the research challenges needed in order to move ahead.
I hope my 2018 post is still a useful glimpse at the Big Data Paradox idea. That said, I also encourage you to read the Delphi team’s response to (an earlier draft of) Bradley et al.’s Nature paper. In their response, Reinhart and Tibshirani agree that the Delphi-Facebook survey does show sampling bias and that massive sample sizes don’t always drive mean squared errors to zero. But they also argue that Delphi’s survey is still appropriate for its intended uses: quickly detecting possible trends of rapid increase (say, in infections) over time, or finding possible hotspots across nearby geographies. If the bias is relatively stable over short spans of time or space, these estimated differences are still reliable. They also point out how Meng’s data defect correlation is not easily interpreted in the face of survey errors other than sampling bias (such as measurement error). Both Kreuter’s and Reinhart & Tibshirani’s overviews are well worth reading.
Once again, we are hiring a tenure-track statistician here at Colby College, in the Department of Mathematics and Statistics! I should have posted this sooner; but if you are looking for an opportunity to teach Statistics and Data Science at a strong liberal arts college with great students and colleagues, please consider applying:
We will give full consideration to applications received by this Monday, October 14, but review will continue until the position is filled. If you have concerns about making this deadline, or if you have any other questions, please do get in touch: jawieczo@colby.edu … I would also be happy to answer any questions about the position, Colby College, or our city of Waterville, Maine.
Some things that I am particularly excited about this year:
a recent multi-million-dollar gift that is funding Data Science courses, curricular development, speakers, and other activities — and strong encouragement to spend that gift on interdisciplinary projects with colleagues across campus (for example, I have co-organized a data visualization workshop with faculty in Biology and proposed a first-year course cluster to be co-taught with faculty in English);
Eighty years ago this week, my grandmother and grandfather were each enthusiastic seven-year-olds, excited for September 1st — their first day of school! At the time, they lived hundreds of kilometers apart and had yet to meet. She had spent her childhood in France but was thrilled to be back in ancestral Poland, in the north-eastern city of Wilejka, where she would finally be able to study in Polish. He was a voracious reader in Poznań, the westernmost large city in Poland at the time. Still, both had laid out their best clothes and filled a satchel with notebooks and pens.
Of course, it was not to be. My grandfather’s mother woke him in the middle of the night and brought him quietly down to the cellar, in the dark, past windows blacked out with curtains and blankets, as German forces began shelling the city. In the morning his apartment still stood, but he saw the broken walls and ruined rooms of the building next door. Meanwhile, my grandmother’s long-awaited Polish school was cancelled as well, eventually replaced by a Russian school as Soviet forces occupied her city.
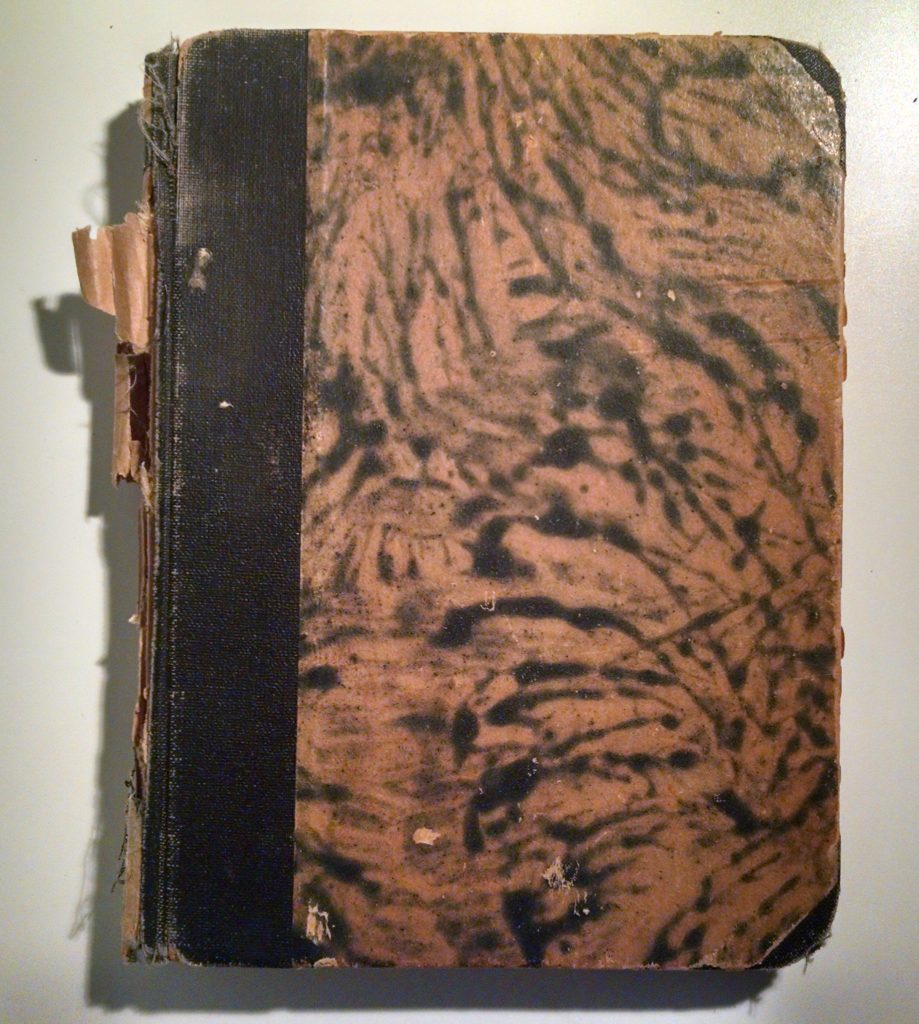
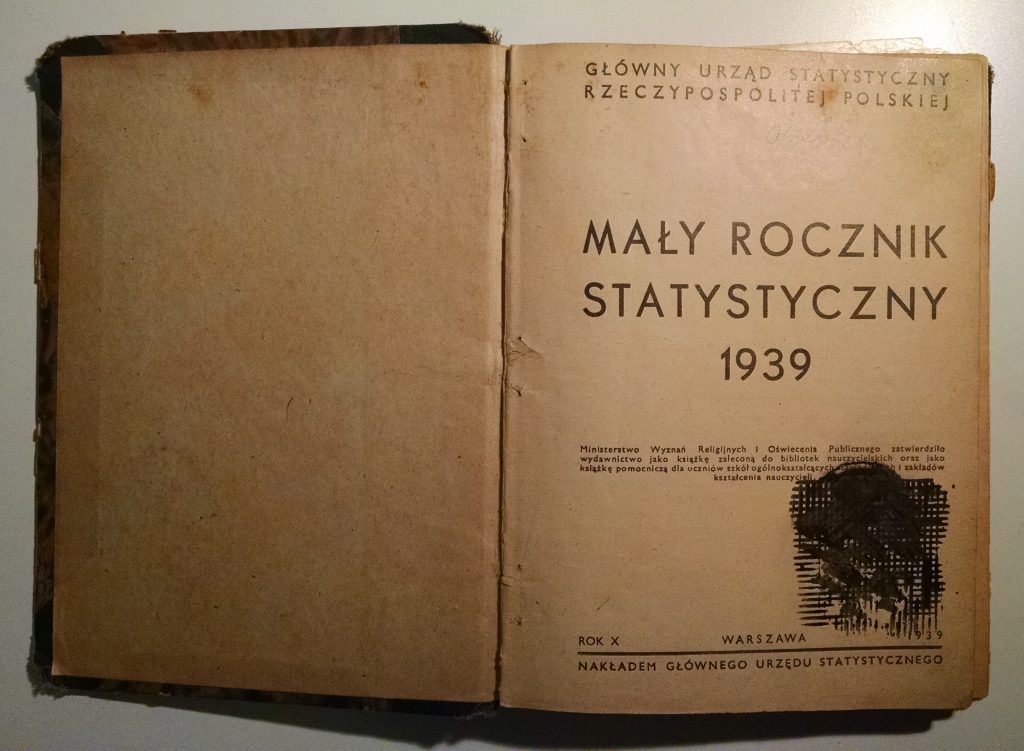
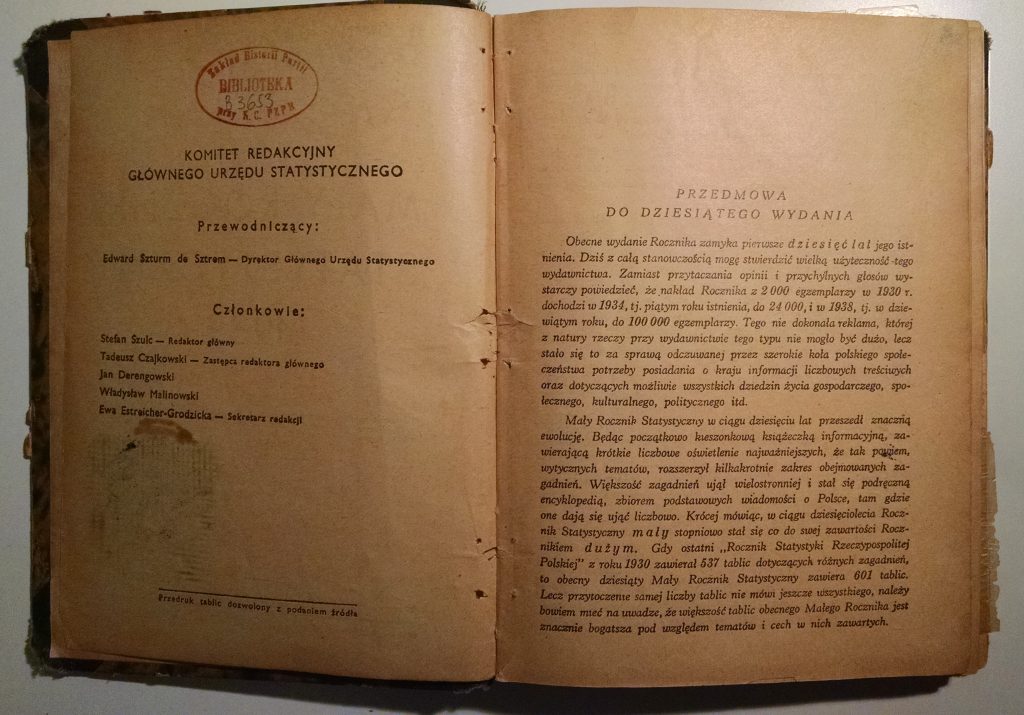
Somehow, they survived World War II and eventually met as teachers, committed to the critical importance of education in rebuilding their broken country. My grandfather went on to become a professor of history and a leading figure at the University of Zielona Góra, in the city where they finally settled (and where I was born). A few years ago, when he passed away, I found some of the old statistical yearbooks he must have used as research resources.
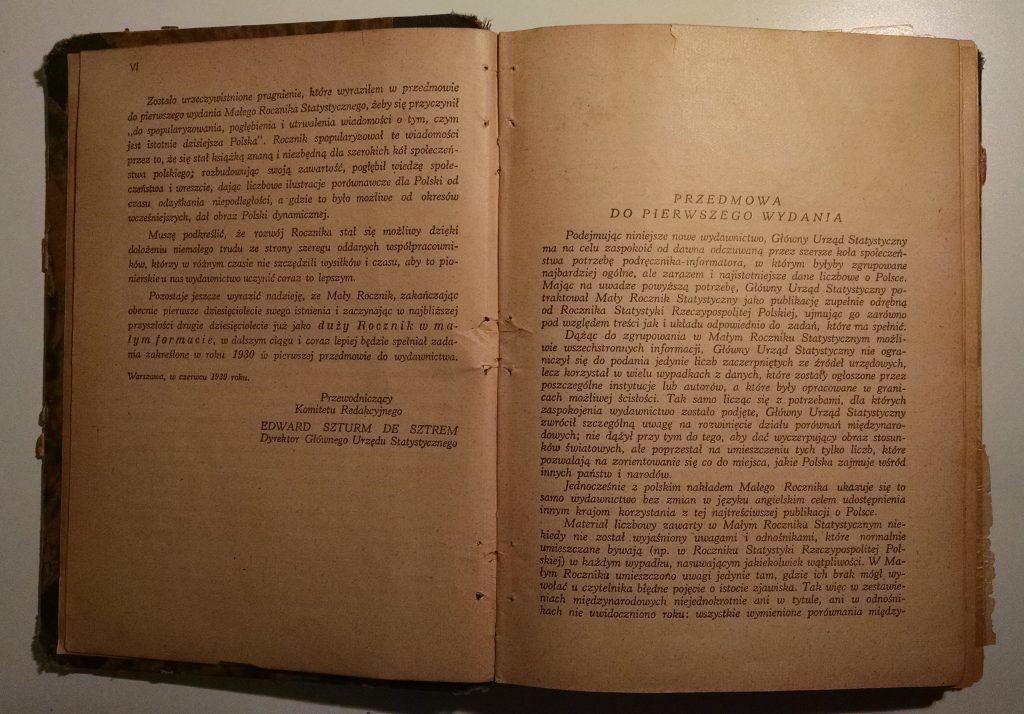
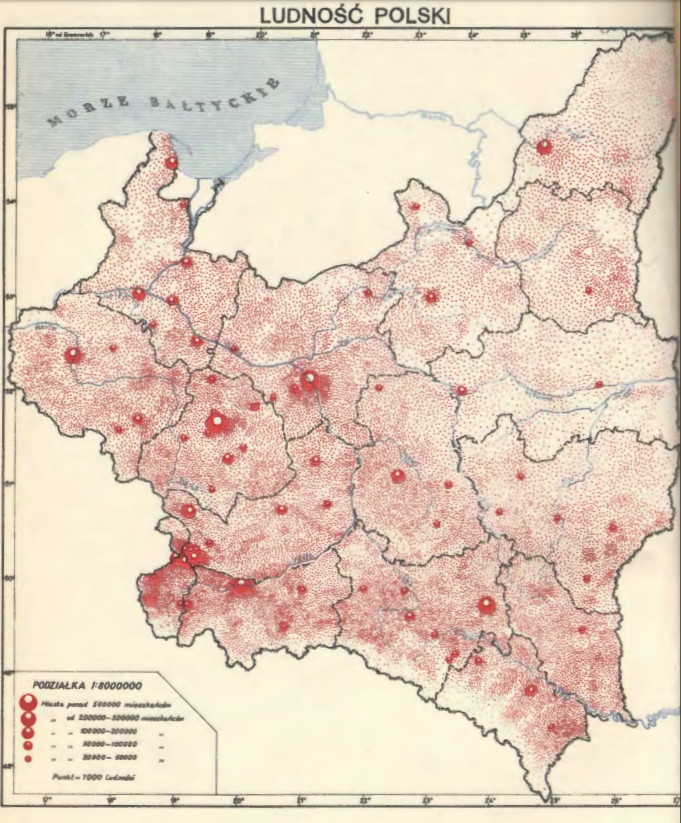
The yearbook from 1939 is particularly touching. As a physical artifact, it has clearly been through a lot: worn from use, spine broken, pages torn, stamped and underlined and scribbled all over.
But it’s the “Foreword to the 10th Edition,” written in April 1939, that really moves me with its premature optimism:
The current edition of the Year-Book closes the first ten years of its existence. Today I can emphatically assert the great utility of this publication … It remains only necessary to express a hope that the Concise Year-Book, completing currently the first decade of its existence and beginning in the near future its second decade… will continually and increasingly fulfill its mission as set out in 1930…
Once again, it was not to be. The statistical service could not continue its planned work, once the war began in September. The Polish government-in-exile in London did manage to publish a Concise Statistical Year-Book for 1939-1941, summarizing what was known about conditions in the German- and Soviet-occupied territories. But the regular annual compilation and publication of Polish statistical yearbooks did not resume until after the war, in 1947 — and even then it was interrupted again during 1951-1955 as the Soviets in charge did not want to risk revealing any state secrets.
Now, on this 80th anniversary of the war, my own son is eager to start school, while I am preparing to bring the 1939 yearbook to my fall course on surveys and censuses. I am grateful that our life today is so much better than my grandparents’ was, even if it’s hard to be optimistic about the state of the world when you hear the news lately. All we can do is roll up our sleeves and get back to work, trying to leave the place better than we found it.
Another Pole, the poet Wisława Szymborska, said it well:
The End and the Beginning
After every war
someone has to clean up.
Things won’t
straighten themselves up, after all.
Someone has to push the rubble
to the side of the road,
so the corpse-filled wagons
can pass.
Someone has to get mired
in scum and ashes,
sofa springs,
splintered glass,
and bloody rags.
Someone has to drag in a girder
to prop up a wall,
Someone has to glaze a window,
rehang a door.
Photogenic it’s not,
and takes years.
All the cameras have left
for another war.
We’ll need the bridges back,
and new railway stations.
Sleeves will go ragged
from rolling them up.
Someone, broom in hand,
still recalls the way it was.
Someone else listens
and nods with unsevered head.
But already there are those nearby
starting to mill about
who will find it dull.
From out of the bushes
sometimes someone still unearths
rusted-out arguments
and carries them to the garbage pile.
Those who knew
what was going on here
must make way for
those who know little.
And less than little.
And finally as little as nothing.
In the grass that has overgrown
causes and effects,
someone must be stretched out
blade of grass in his mouth
gazing at the clouds.
It’s a strange thing to finish a thesis. You came in to grad school hoping, maybe even expecting, to make a grand contribution—a deep insight into the nature of the world. But Borges puts it best:
…the tall, haughty volumes that made a golden dimness in the corner of his room were not (as his vanity had dreamed them) a mirror of the world, but just another thing added to the world’s contents.
For that matter, when do you really “finish”? The dissertation is pretty much written — then a few weeks later the slides are ready — then the defense itself takes place — then you make revisions — then there’s a graduation ceremony — and even then, there remain a few minor “suggested” revisions I haven’t done yet but should do before getting it printed & bound & archived. [That finally happened half a year later, over January break, long after the PhD was “over.”]
Not to mention, my status felt weirdly ambiguous. The faculty at Colby have already hired me and seem to treat me as basically a colleague, pending the minor formality of defending. And at CMU I’m also teaching a course and students are calling me “Professor.” But of course, everyone else in the department is used to treating me as a student, so I feel very much like one. Admittedly, during the few weeks when I was no longer a “PhD Candidate” but not yet officially “Dr Wieczorek,” I enjoyed the brief chance to introduce myself as a “Graduand” 🙂
But it’s all very anticlimactic! There’s no trumpet fanfare saying: “NOW you are done.” If anything, it felt like the first Zelda game’s end music (starting about 20 sec into the clip below):
As you’ve played the game through, you’ve died many many times along the way, and Link’s death lullaby has been playing so long in all your lowest moments that you don’t even really hear it anymore. Then here it returns, after you thought you were done. Not this again?!? Yet suddenly your ears catch a faint counterpoint that wasn’t there before. This new bass line changes the character of the music completely, getting stronger and stronger, until somehow it has become a jazzy, celebratory tune. There’s no one moment of enlightenment, but a weary transition as the world slowly starts looking better and better.
Teaching
While I didn’t finish as much of the thesis last fall as I expected, it was supposed to be my focus this spring (along with the new baby!), with only minimal grading responsibilities as a TA.
HOWEVER… a week before spring term started, a last-minute shift in staffing became necessary and I was asked to teach 36-315, Statistical Graphics and Visualization—a hundred-student undergraduate class. I really should have said No (the chair told me it’s okay to say No!), but still, the department seemed to be at a loss, and I didn’t want to let them down after all they had done for me throughout my time at CMU. So instead, I found myself focused on teaching the largest class I’ve had yet, while just scraping by on both research and parenting.
This spring I also finished the last requirement for the Eberly Center’s Future Faculty Program. It was a bit funny to have to revise my Statement of Teaching Philosophy several times, given that I’d already written one that got me a job, but it does feel good to wrap this up formally. The program made a big impact on my teaching over the past few years, and I’m glad I can contribute to their completion rate.
Other projects
We continued our Teaching Statistics research, running many more think-aloud interviews, and presented our work at eCOTS 2018 (the Electronic Conference on Teaching Statistics).
I also traveled back to DC, to the Census Bureau, to give a talk on my paper with Tommy Wright and Martin Klein. The paper is about visualizations designed to help readers make many comparisons in a statistically-appropriate way. The talk was recorded, and now I see the video has been posted as part of a new “Census Academy” resource.
Life
The baby went through a rough patch where he wouldn’t fall sleep unless someone was holding him and moving around—sitting wasn’t good enough. Somehow I discovered that I could hold him while playing Crypt of the NecroDancer, which is basically a mashup of Dance Dance Revolution and Legend of Zelda: you use the arrow keys to move your dungeon-explorer in time with the beat of this amazing techo-ish soundtrack. I would play with one hand, standing and rocking back and forth to help myself stick to the beat, and the little guy would just fall asleep contentedly while I repeatedly destroyed got killed by skeletons and slime monsters.
Despite everyone’s sensible advice, we went house-hunting in Maine in mid-March—when all the houses were covered in 3 feet of snow—because spring break was the only time I could get away. Surprisingly, nobody else was house-hunting there that week 🙂 and as it turned out, we found a wonderful home at a very reasonable price. Our landlord in Pittsburgh has been wonderful, but we’re excited to become homeowners.
Comics
So, at this point you might be wondering: Is a PhD degree in Statistics worthwhile?
Someday I’ll follow up with a post on that, akin to my MS degree post. Meanwhile, Matt Might has the best post on the value of a PhD in general.
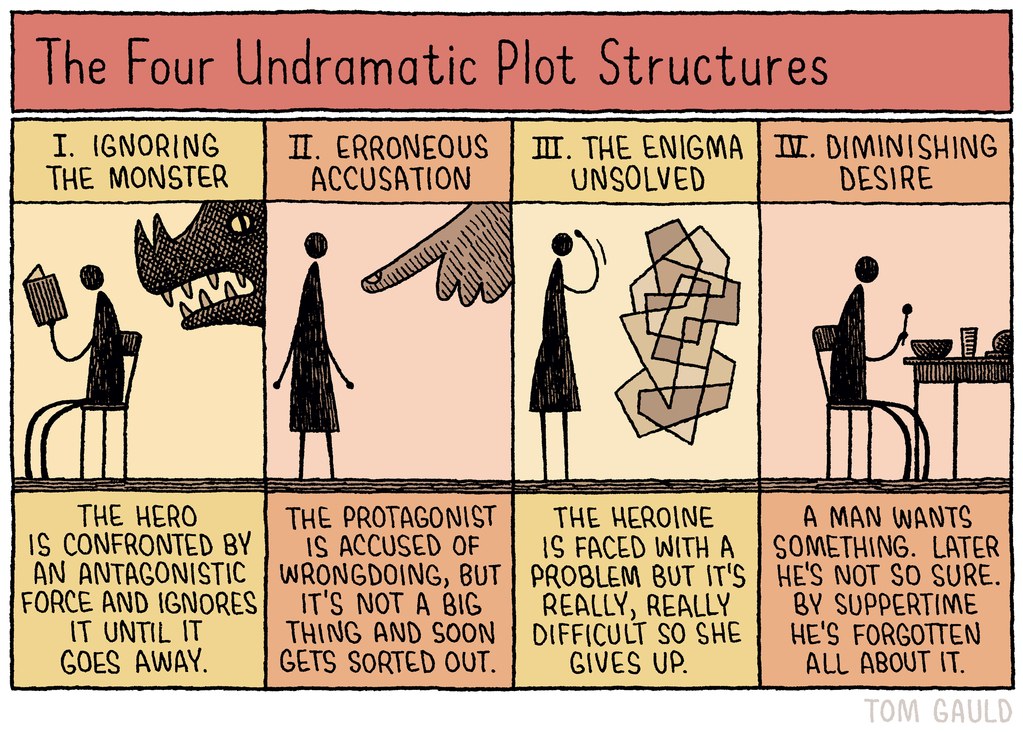
But for today, I will leave you with some comics that kept me crying smiling during the tough times of a PhD. Of course, PHD Comics (aka Piled Higher and Deeper) and XKCD both go without saying, but here are a few others that felt relevant.
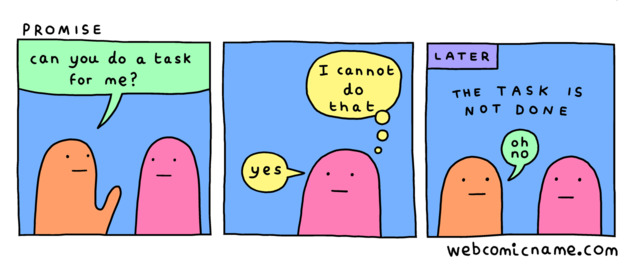
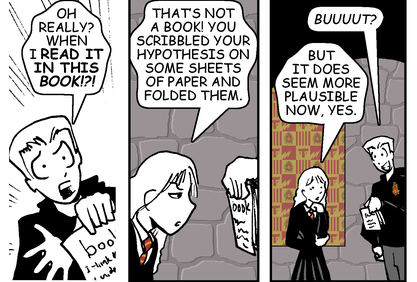
When you’re starting down this precarious road:
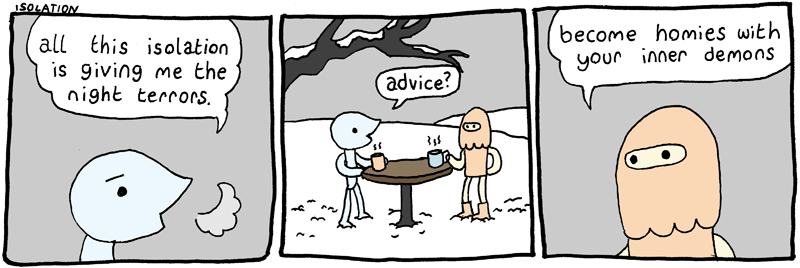
When you forget why you’re even doing this:
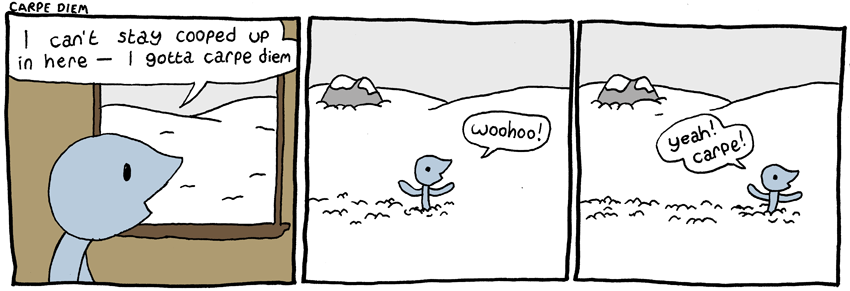
When you have spent years with almost no human company besides other academics no human company:
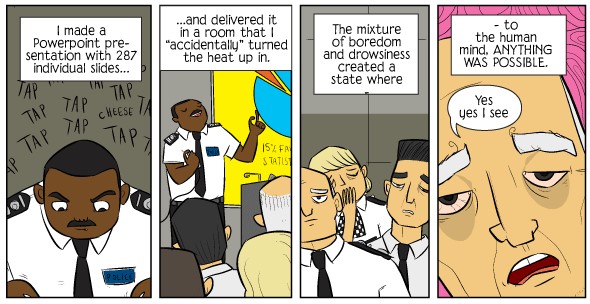
When you are suddenly expected to interview for jobs with bona fide humans, after spending years around aforementioned academics:
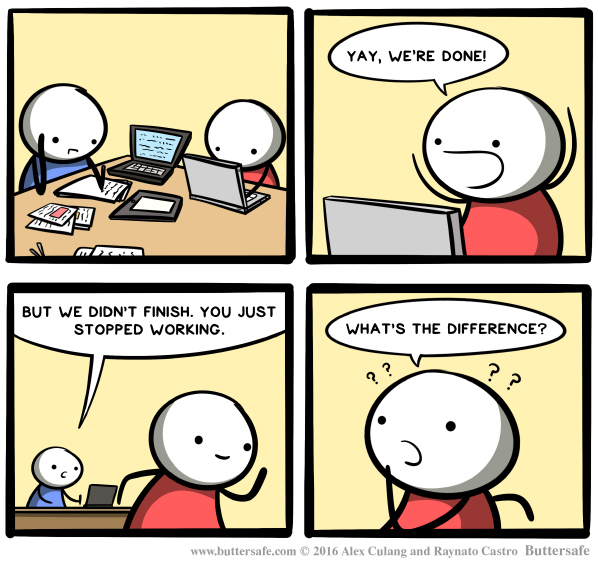
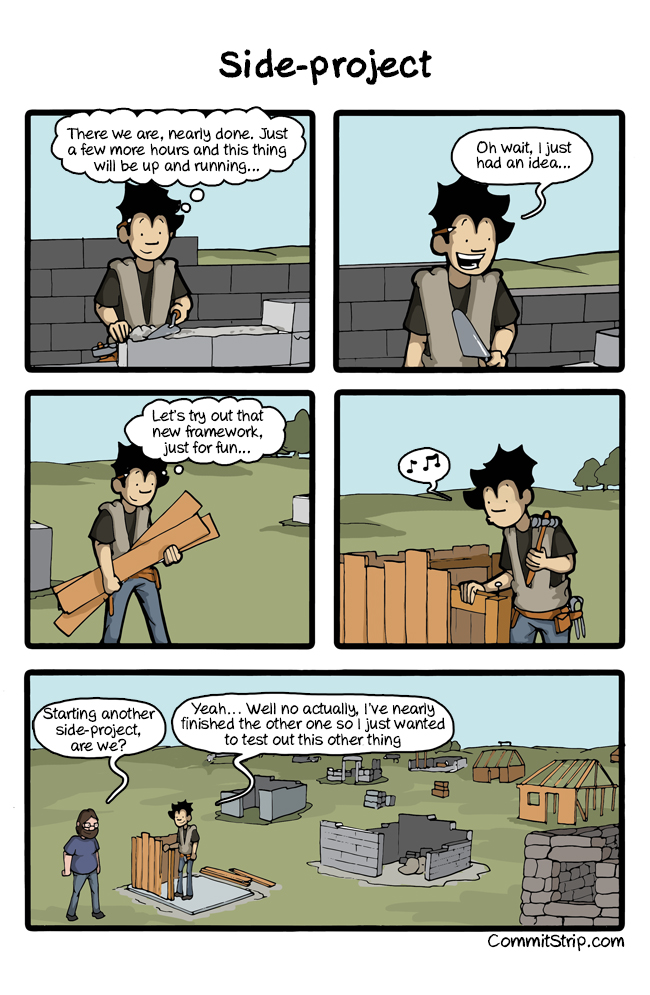
When you are neeeeeearly done, and if you could just focus on your existing responsibilities you’d be able to wrap them up:
When you somehow manage to buckle down and knock out a ton of research/writing like a boss:
When you finally submit the damned dissertation:
When you are as ready as you’ll ever be for the thesis defense:
When you look back on your time as a PhD student with a note of defiant optimism:
The final year! Our 2nd baby was on the way, and the job search was imminent. Oh, and by the way there’s this little thing called “finishing your dissertation”…
Previous posts: the 1st, 2nd, 3rd, 4th, 5th, 6th, 7th, and 8th semesters of my Statistics PhD program.
Research
This year my advisor was able to place me on half-TA’ing grant support. So I asked to have all my TA’ing pushed to the spring, with the intent of finishing the bulk of my thesis work this fall. I figured that in the spring I’ll be OK to grade 10 hrs/wk on my own time while helping with the new baby (due in Dec), as long as the thesis is mostly done.
However, job hunting took a HUGE amount of time. That’ll be its own post. (Also the spring TA duties turned into something larger, but that’s a story for the next post.)
In other words, thesis research progress was… minimal, to put it mildly.
Other projects
Well, OK, so there’s another reason my thesis work was slow: I jumped onto two new short-term projects that (1) were very much in my wheelhouse, and (2) seemed like great fodder for job applications and interviews. Both of them arose thanks to Ryan Tibshirani. Unsurprisingly, it turns out that it’s GREAT for a grad student to be on good terms with a well-known professor who gets too many requests for interesting projects and occasionally passes them on to students. In both cases, it was fantastic of Ryan to think of me, and although it’s been tough to be doing it just right now, this is legitimately the kind of research I want to do later on (and probably should have done for my thesis in the first place! argh…).
First, knowing that I’m interested in education, Ryan asked if I’d like to help with some consulting for Duolingo, the language-learning app company (also founded by CMU folks and still Pittsburgh-based). The folks there had some interesting questions about experimental design and suitable metrics for A/B testing their app. One of our contacts there was Burr Settles, who wrote a helpful book on Active Learning (the ML technique, not the pedagogy). We had some good discussions after digging into the details of their problem: challenges of running permutation tests on massive datasets, whether old-school tests like sign-rank tests would be better for their goals, how the data-over-time structure affects their analyses, etc. These chats even led me to an old Portland State classmate’s work regarding how to get confidence intervals from a permutation test, and I have some ideas for extensions on that particular problem.
Second, knowing that I had experience with survey data, Ryan passed on to me an email request to review some new methodology. Varun Kshirsagar, working on the Poverty Probability Index (PPI), had made some revisions to this poverty-tracking method and wanted to get feedback from someone who understood both modern statistics & machine learning tools as well as the kind of complex-survey-design datasets used to estimate the PPI models. It was a real pleasure working with Varun, and thinking about how to combine these two worlds (ML and survey data) had been a huge part of my motivation to go back to grad school in the first place and attend CMU in particular. We wrote up a short paper on the method for the NIPS 2017 workshop on ML for the Developing World, and we won the best paper award 🙂 I plan to revisit some of these ideas in future research: How do we run logistic-regression lasso or elastic net with survey-weighted data? How should we cross-validate when the survey design is not iid?
Teaching
Alex and I also continued running the Teach Stats mini. This semester we decided it was a bit embarrassing that Statistics, of all fields, doesn’t have a better standardized assessment of what students are learning in our intro courses. Without such a tool, it’s hard to do good pedagogy research and give strong evidence about whether your interventions / new methods have any impact.
There are already a couple of assessment instruments out there, but most were written by psychologists or engineers rather than by statisticians. Also, many of their questions are procedural, rather than about conceptual understanding. Even though these assessments have passed all the standard psychometric tests, there’s no guarantee that whatever they measure is actually the thing we’d *like* to measure.
So we started discussing what we’d like to measure instead, drafting questions, and planning out how we would validate these questions. Inspired by my own experiences in user-experience research at Olin and Ziba, and with the help of an article on writing good assessments for physics education by Adams and Wieman, we started planning think-aloud studies. The idea is to watch students work through our problems, talking out loud as they do so, so that we can see where they trip up. Do they get it wrong just because the question is poorly worded, even if they understand the concept? Do they get it right just because you can eliminate some choices immediately, even if they don’t understand the concept at all?
We ran a pilot study this fall, and at the end of the semester, I had my first chance to help draft an IRB application—hurrah for statisticians actually working on research design!
This summer and fall, I also kept up with an informal History of Stats reading group organized by fellow PhD student Lee Richardson. Again, these journal-clubs and reading-groups have been my favorite part of the PhD curriculum, and I wish more of our “real” classes had been run this way.
Life
?!? “Life”? Not much that I can recall this semester.
Next up
The 10th and final semester of my Statistics PhD program.